Speed Kills: Putting the Selloff into Perspective
Written by Ken on 2020-03-10
Likely when you woke up this morning you were met with headlines like “historic selloff”, “bear market” or “financial crisis” but as rational and smart investors I wanted to take a few minutes to put yesterday’s selloff into perspective.
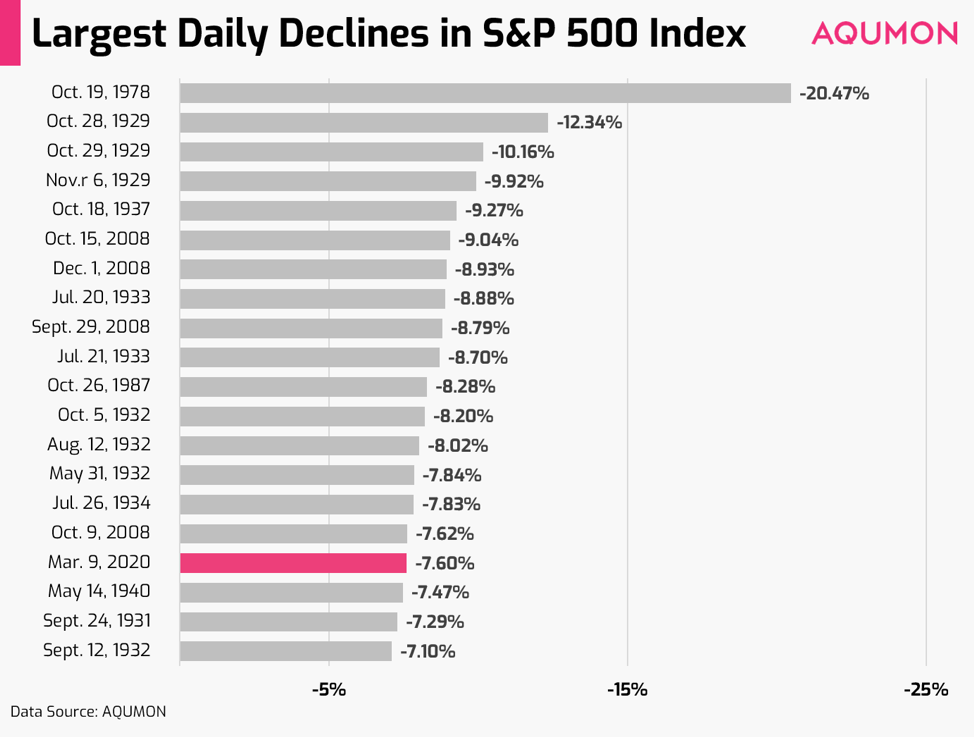
Yesterday was a big selloff in U.S. stock markets (S&P 500 Index) but if we look back it is only ranked as the 17th largest single day decline.
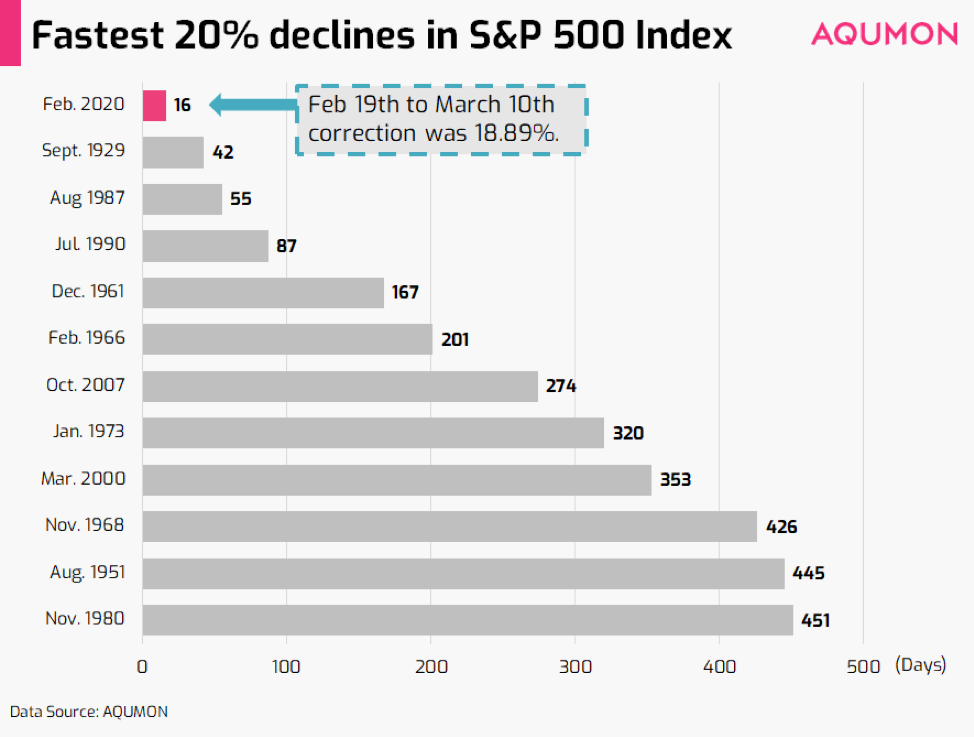
What has caught most investors off guard was the speed of the selloff. The S&P 500 Index from it’s peak on Feb 19th until last night (Monday) was -18.89%. This only took 16 days. Although not yet 20% correction (what is technically deemed a “bear market”) here is a look at how the past 20% declines for the S&P 500 Index compare:
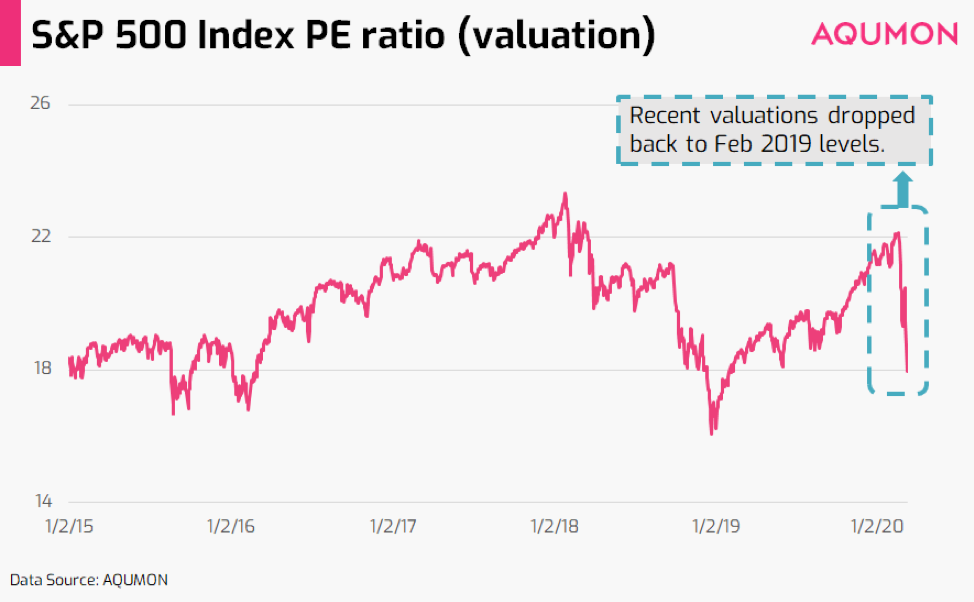
We’ve been talking about this for a few weeks now with investors that this was initially profit taking driven pullback given valuations were on the high side (stocks were ‘expensive’) but valuations have come down significantly back to 19.98. These are levels closer to February 2019 (markets were at a bottom back in December 2018).
But lately it has been more driven by the fear generated from the impact of the coronavirus. Even though transmission growth numbers are showing early signs of slowing in Asia (this still remains to be seen) the outbreak in Europe and the United States is spreading quickly. Mix in the unknowns from the U.S. elections and high expectations of central banks coming in to save the day and this resulted in heightened volatility during this period.
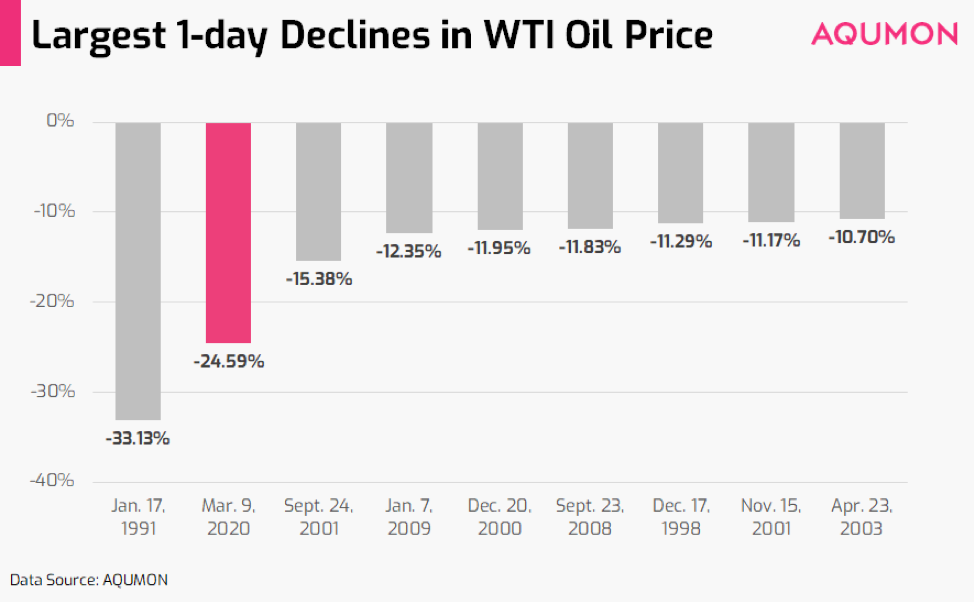
The biggest blind side hit yesterday came from the oil dispute between Saudi Arabia. Not since 1991 as investors have we ever seen a daily decline that was greater than 20% (WTI crude was down over 30% at one point yesterday).
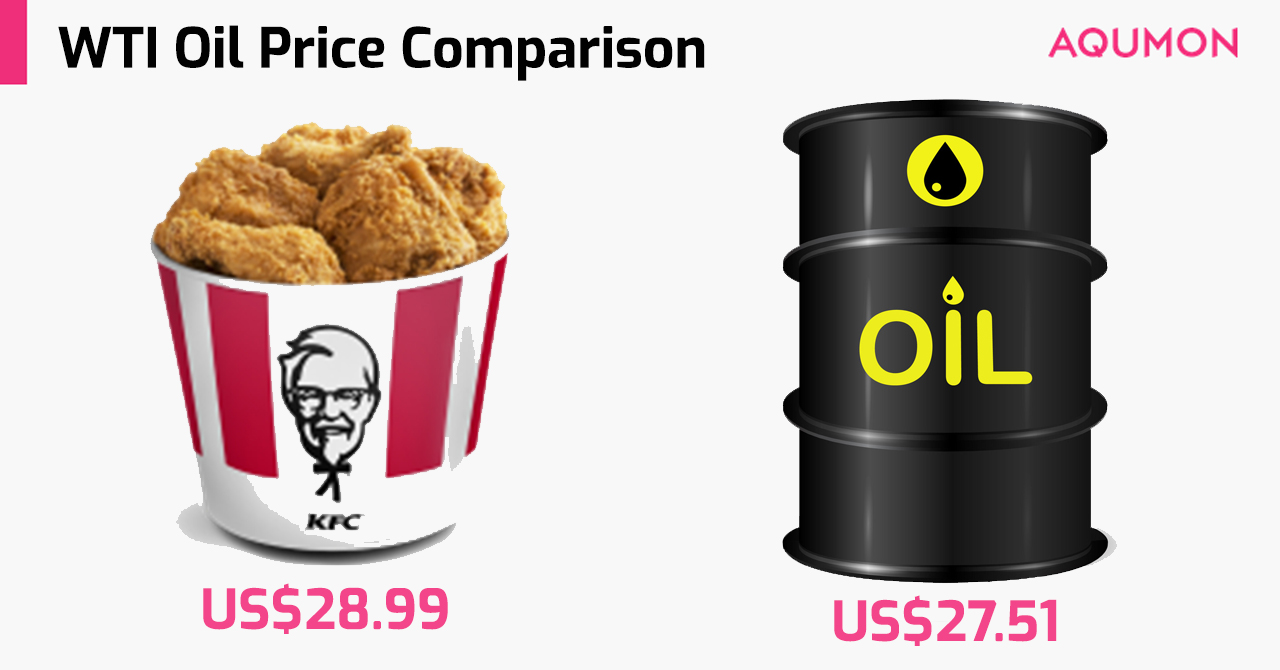
As a good friend reminded me of this reference we made back in 2016 (last time WTI crude traded below US$30) that shows WTI crude yesterday costs about as much as a bucket of Kentucky Fried Chicken. How times have changed.
So now that the dust has somewhat settled (local Hong Kong and China stocks are up 1-2% today as of 12pm Hong Kong time and U.S. stock markets according to the futures market look to rebound around 2% tonight) what are we looking at?
Risk on the horizon
1) Development of the coronavirus in the U.S. and Europe:
With global infection cases now exceeding 114,379 cases we are seeing aggressive action being taken in Europe. Italy extends the coronavirus lockdown to their entire country of 60 million people. The United States now is starting to see more than 20 universities opt for online learning and schools are mulling closures as well.
As we mentioned in our last Market Insights, we are closely monitoring the healthcare infrastructure since this would snowball into bigger issues if their hospitals gets overwhelmed with patients.
2) Effectiveness of stimulus from central banks and governments:
United States president Donald Trump yesterday he is meeting today (Tuesday) to discuss “a possible tax relief measure” to provide “a timely and effective response to the coronavirus.”. The European Central Bank (ECB) is also on the clock for Thursday in terms of whether they will provide any monetary stimulus. Other central banks are potentially waiting in the wings to take action to uplift the current market.
For many major central banks at slightly above zero (e.g. U.S.’ Federal Reserve) to negative (e.g. ECB and Bank of Japan) interest rates levels they may not have many bullets left although cutting rates may not be the only weapon they have in their stimulus arsenal.
The big question is: are these actions still effective? The risk that markets are up against is if we find out these actions create no effect.
3) Impact from oil selloff on bonds:
Even though WTI crude prices have rebounded 6.59% as of noon Hong Kong time but this doesn’t mean as investors we are in the clear. Close to 15% of the U.S. high yield bond index are in energy companies and the squeeze from lower oil prices could mean future corporate and in turn bond default rates are higher.
Furthermore companies looking to raise capital will also likely find the current investment environment much harder to do so. This is more of a medium term risk.
The same friend I mentioned earlier has been reminding me about the wise words by Warren Buffet “be greedy when others are fearful” which means that the expected returns for stocks normally go up after they have taken a tumble. Does the numbers back that up?
If we look at the S&P 500 Index from 1950 until end February 2020 we see the average 1-year basis average return is around 8.8%. After a 15% decline by the index this number jumps up to 10.4%. After a 20% decline this number jumps to 11.9%. The numbers don’t lie.
Although there are quite a lot of unknowns in the market ahead, stay rational, stay calm and as Warren said stay greedy when others are fearful.
Thank you again for your continued support for AQUMON, stay safe outside and happy investing!
About us
As a leading startup in the FinTech space, AQUMON aims to make sophisticated investment advice cost-effective, transparent and accessible to both institutional and retail markets, via the adoptions of scalable technology platforms and automated investment algorithms.
AQUMON’s parent company Magnum Research Limited is licensed with Type 1, 4 and 9 under the Securities and Futures Commission of Hong Kong. In 2017, AQUMON became the first independent Robo Advisor to be accredited by the SFC.
AQUMON’s investors include Alibaba Entrepreneurs Fund, Bank of China International and HKUST.
Disclaimer
Viewers should note that the views and opinions expressed in this material do not necessarily represent those of Magnum Research Group and its founders and employees. Magnum Research Group does not provide any representation or warranty, whether express or implied in the material, in relation to the accuracy, completeness or reliability of the information contained herein nor is it intended to be a complete statement or summary of the financial markets or developments referred to in this material. This material is presented solely for informational and educational purposes and has not been prepared with regard to the specific investment objectives, financial situation or particular needs of any specific recipient. Viewers should not construe the contents of this material as legal, tax, accounting, regulatory or other specialist of technical advice or services or investment advice or a personal recommendation. It should not be regarded by viewers as a substitute for the exercise of their own judgement. Viewers should always seek expert advice to aid decision on whether or not to use the product presented in the marketing material. This material does not constitute a solicitation, offer, or invitation to any person to invest in the intellectual property products of Magnum Research Group, nor does it constitute a solicitation, offer, or invitation to any person who resides in the jurisdiction where the local securities law prohibits such offer. Investment involves risk. The value of investments and its returns may go up and down and cannot be guaranteed. Investors may not be able to recover the original investment amount. Changes in exchange rates may also result in an increase or decrease in the value of investments. Any investment performance information presented is for demonstration purposes only and is no indication of future returns. Any opinions expressed in this material may differ or be contrary to opinions expressed by other business areas or groups of Magnum Research Limited and has not been updated. Neither Magnum Research Limited nor any of its founders, directors, officers, employees or agents accepts any liability for any loss or damage arising out of the use of all or any part of this material or reliance upon any information contained herein.