

Swinging Your Investment Style in 2019?
Written by Jiaqi & Ria on 2019-01-22
Despite having Warren Buffett as its avid advocate, value investing hasn’t been able to gain traction in China. Due to the unique market environment, participants have struggled to find a consistently performing strategy.
“Those funds which are top-ranked may be nowhere to be seen in the next three years”; “The return of the fund looks fairly good until after you have bought it.”

One of the biggest reasons for managers to be unable to perform well consistently is that the market style in China changes rapidly and investment managers often fail to catch up with these changes. Market tends to carry different styles in different times. Stocks with certain characteristics may outperform those with the opposite characteristics. Common characteristic-pairs include big market capitalization vs small market capitalization and value vs growth: sometimes value stocks tend to prevail over growth stocks, and other times the opposite could happen.
China A-share / H-share Market Style
Compared to the stable market style in the US, China market style changes rapidly. Generally speaking, a single market style can last for somewhere between 6-month to one year.
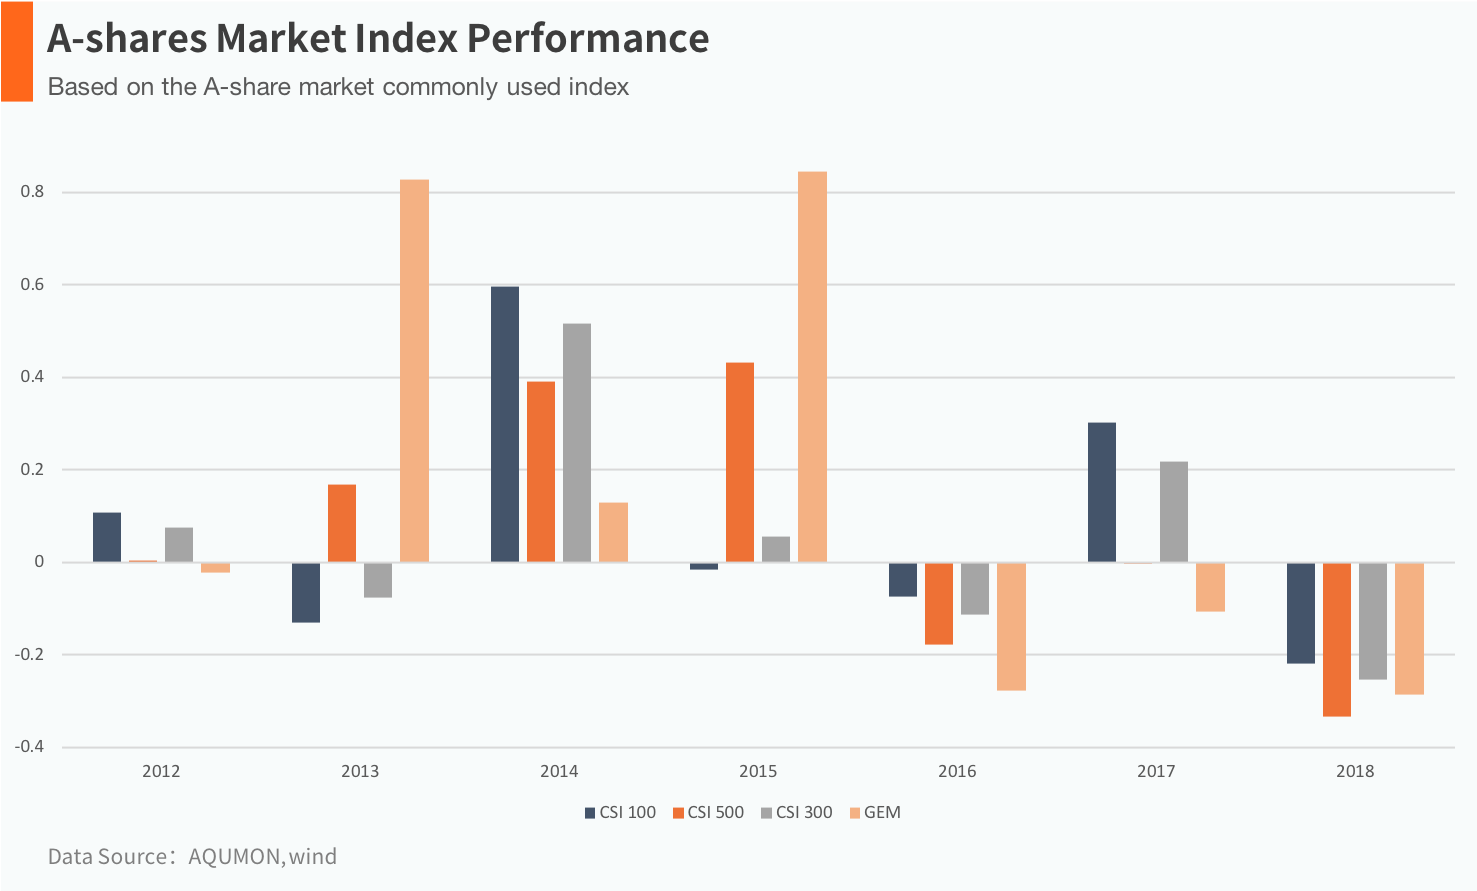
The above graph shows that the A-share market mainly focused on big cap and value stocks in 2012, with these strategies outperforming the rest, including small cap and growth. However, in 2013, large cap stock were no long the best to own: Growth Stocks were up by more than 80%. Big cap and value stocks came back top in 2014. Small cap stocks significantly outperformed the big cap stocks before the stock market crash in 2015 and small cap stocks began to underperform the big cap stocks after the crash, which indicated that the market style has experienced a reversal.
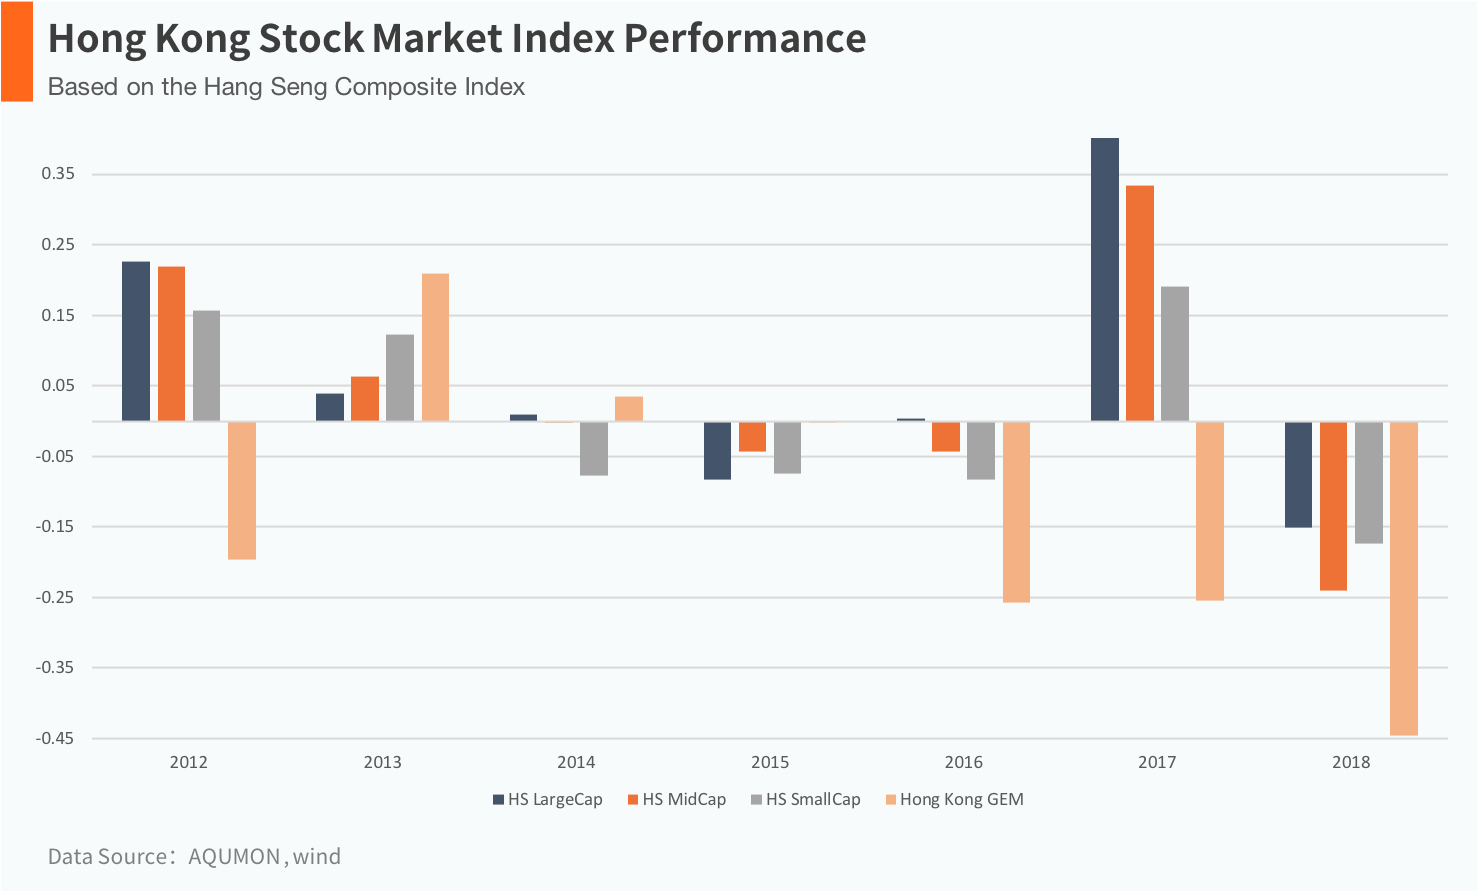
Similar to A-share market, H-share market also went through changes in terms of market styles in recent years. Although the participants in H-share market are more sophisticated than those in A-share market, market style reversals do exist in H-share market: the emergences of Shanghai-Hong Kong Stock Connect and Shenzhen-Hong Kong Stock Connect make it easier for two markets to interact with and affect each other.
Most stocks are highly sensitive to market styles. If investors focus only on one market style and fail to catch up with the fluctuation, they can suffer substantial losses.
Two Market Style Reversals in 2018
2018 is a difficult year. It is not only because market index dropped dramatically and all sectors suffered losses, but also because in 2018 we witnessed market styles and factor styles reversals, for which investors were obviously unprepared.
Small cap stock index has been rising all along in the first half of 2018. It rose by over 10% till the end of May, while other indices had only less than 3% in return. When the market started to collapse in June, small cap stocks suffered the greatest loss and the returns in the following seven months underperformed all other indices, dropping by 27.54%: the 2018 whole year return turned out to be -19.69%.
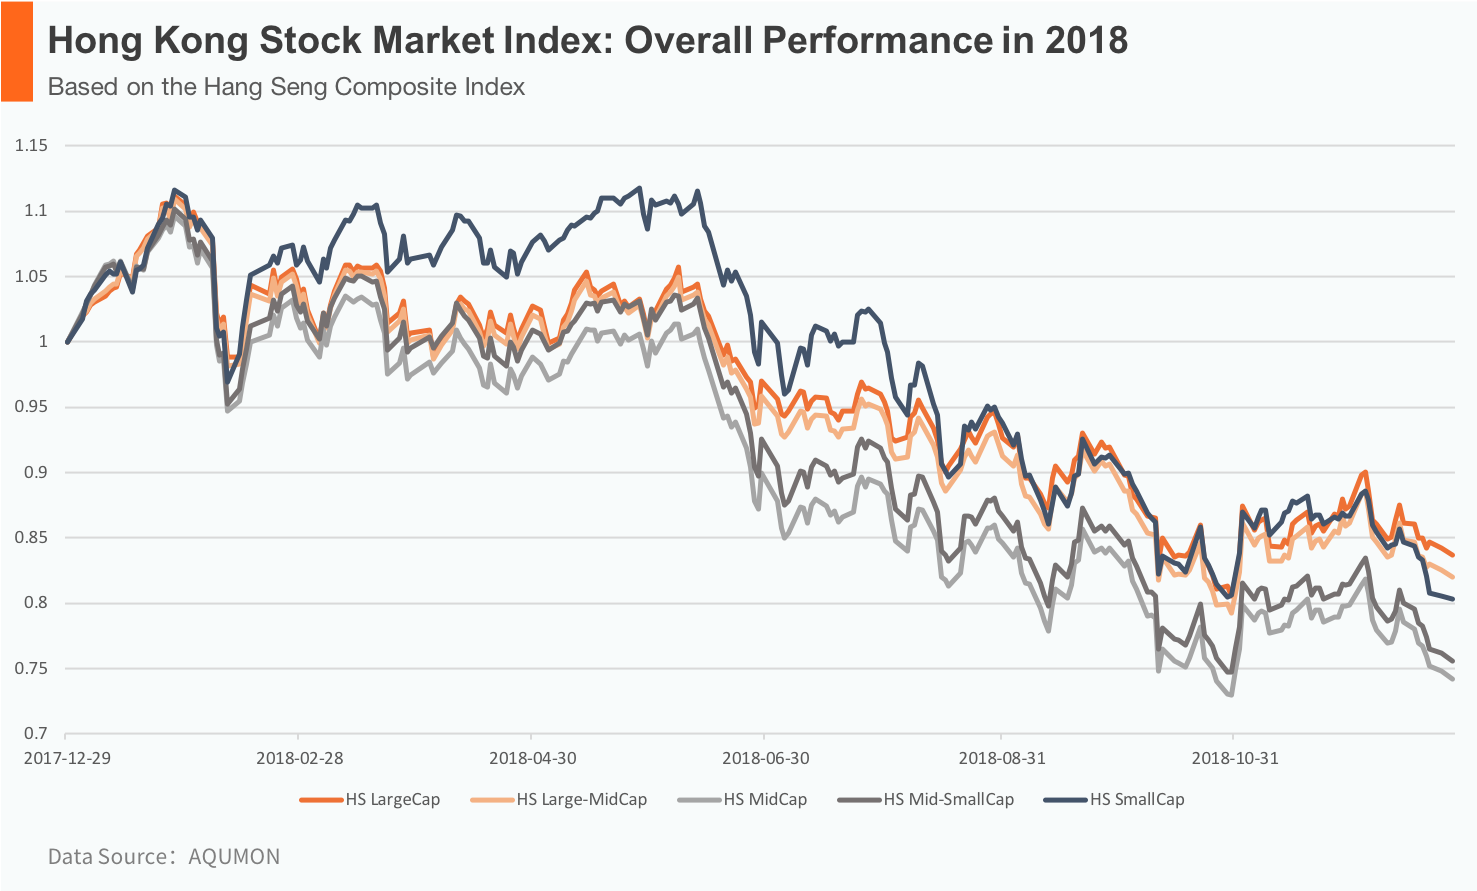 △The market style reversed in Hong Kong stock market in mid 2018
Apart from changes in market value, the stock market factor also went through some style reversals.
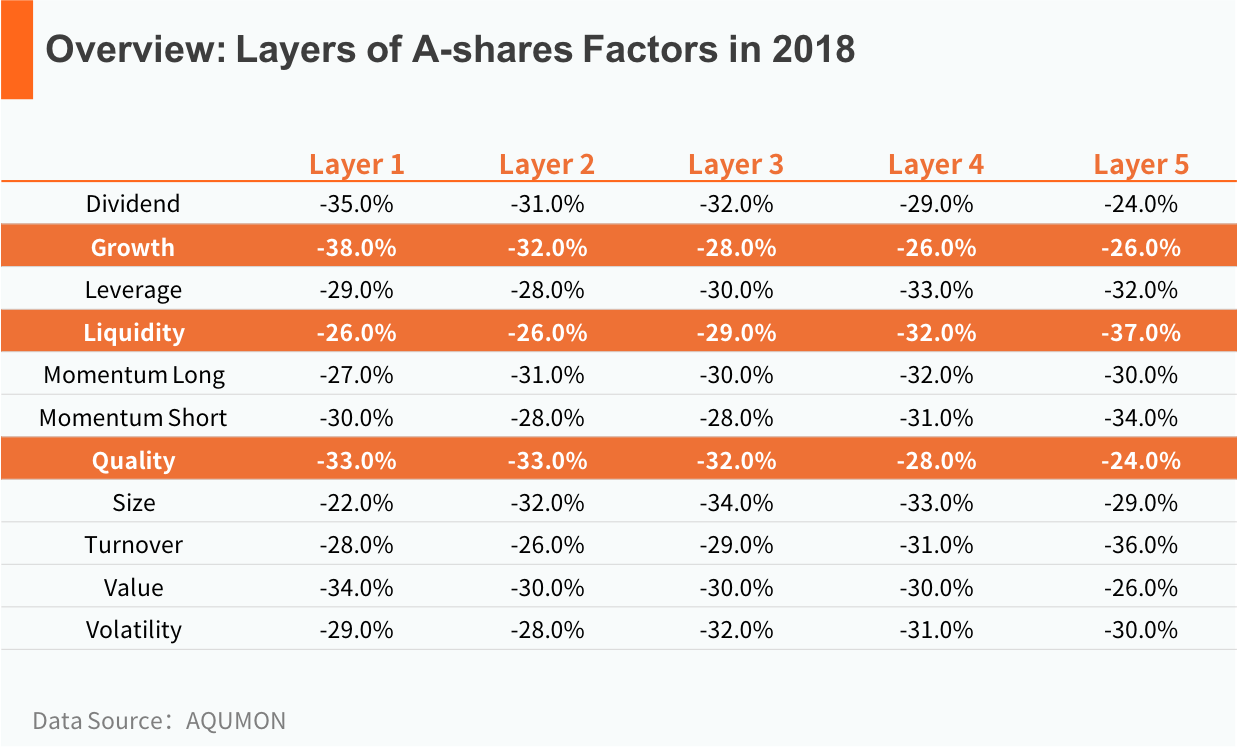
We categorize the stocks according to their factor characteristics. At the beginning of every month, we rank the factor value of last month in descending order and classify the value into five layers based on the five quantiles of factor value: bottom 20%, 40%, 60%, 80% and top 100%.
We can also find that the stock portfolios with higher liquidity and turnover rate performed better in the first half of 2018. However, factor style has changed dramatically since June and the stocks with low liquidity and turnover rate significantly outperformed other portfolios.
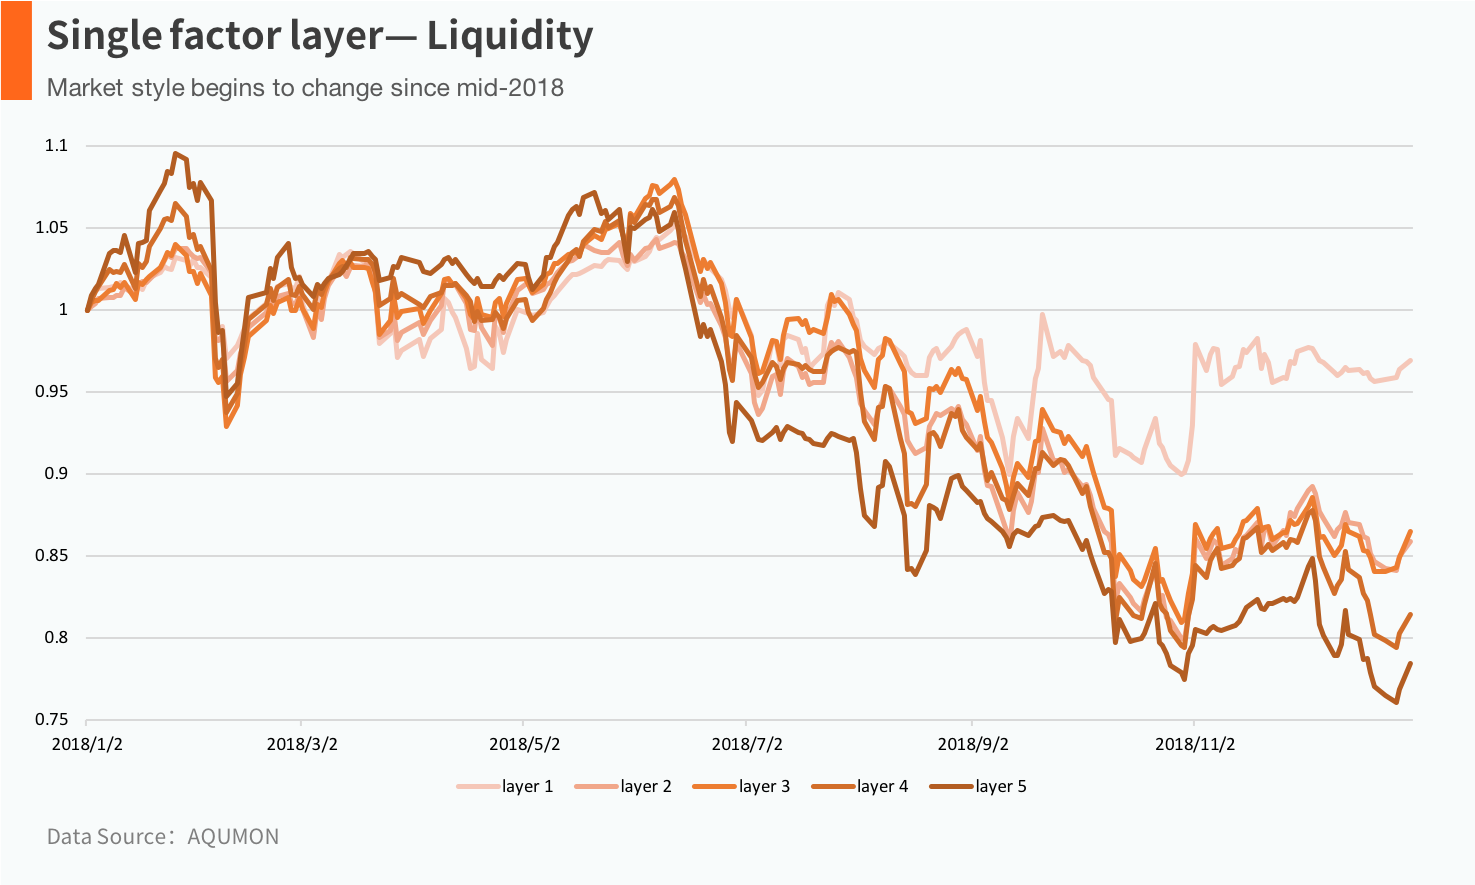 △Liquidity-Relevant factors calculated using stock trading volume during a time period
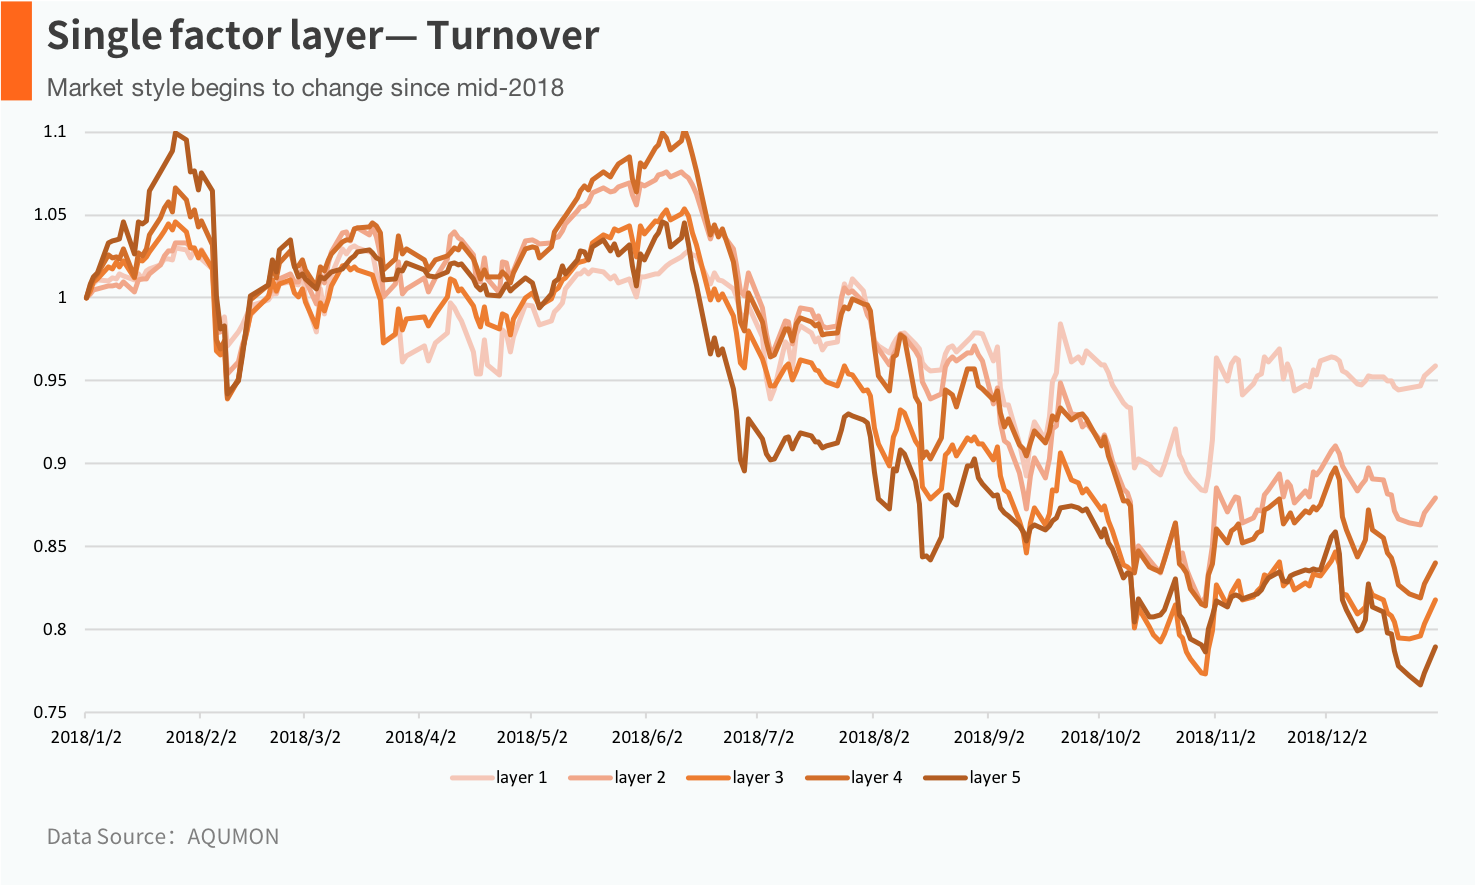 △Turnover Rate-Relevant factors calculated using stock turnover rate during a time period.
In November, Hong Kong stocks rose after a six-month continuous decline, with an increase of 6.11%: the market style of H-shares reversed again.
Below table shows the correlation between factors and rate of return. +(-)means positive(negative) correlation: higher value of factor indicates a higher rate of return if the correlation is positive and vice versa.
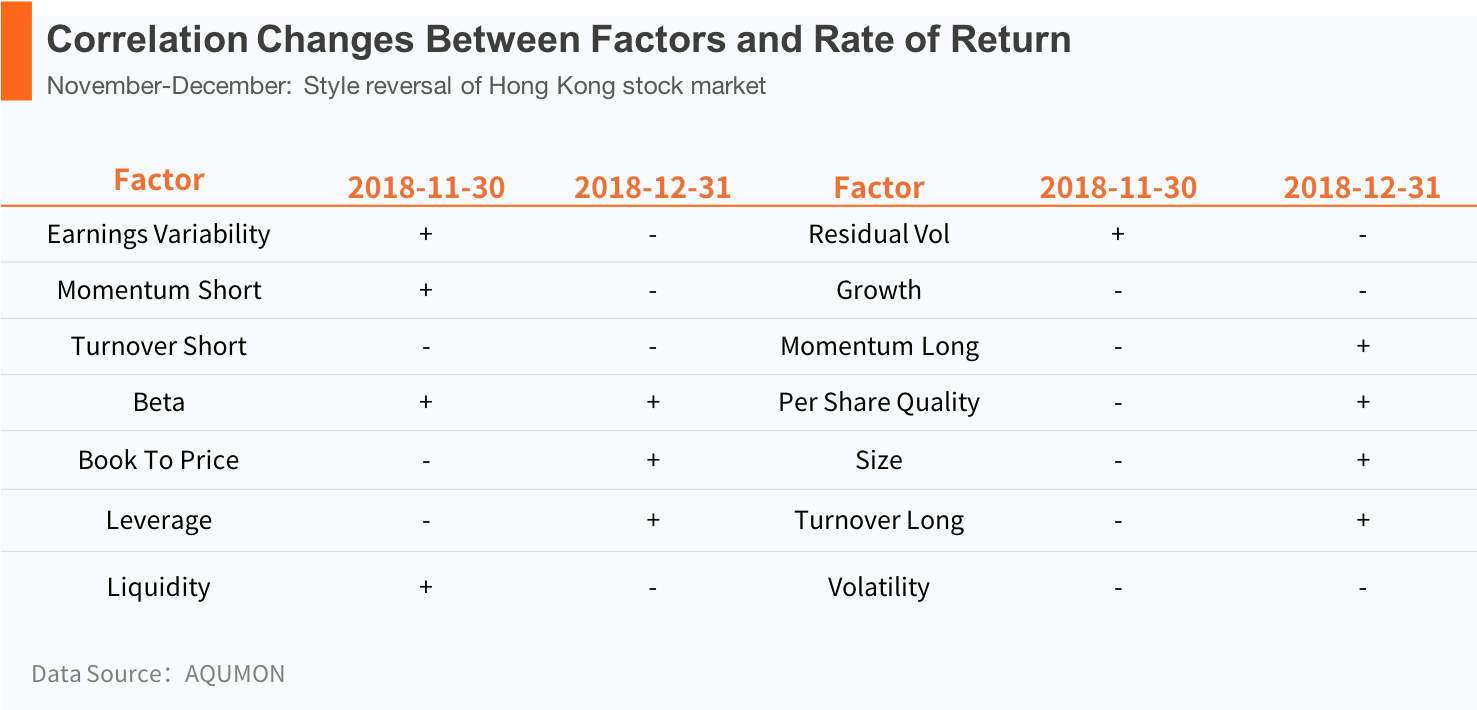
As shown in the graph, for the two months, the direction of correlation has changed for most of the factors. In other words, the market style has reversed again during the two months.
2018 vs 2019, what we know about the market style
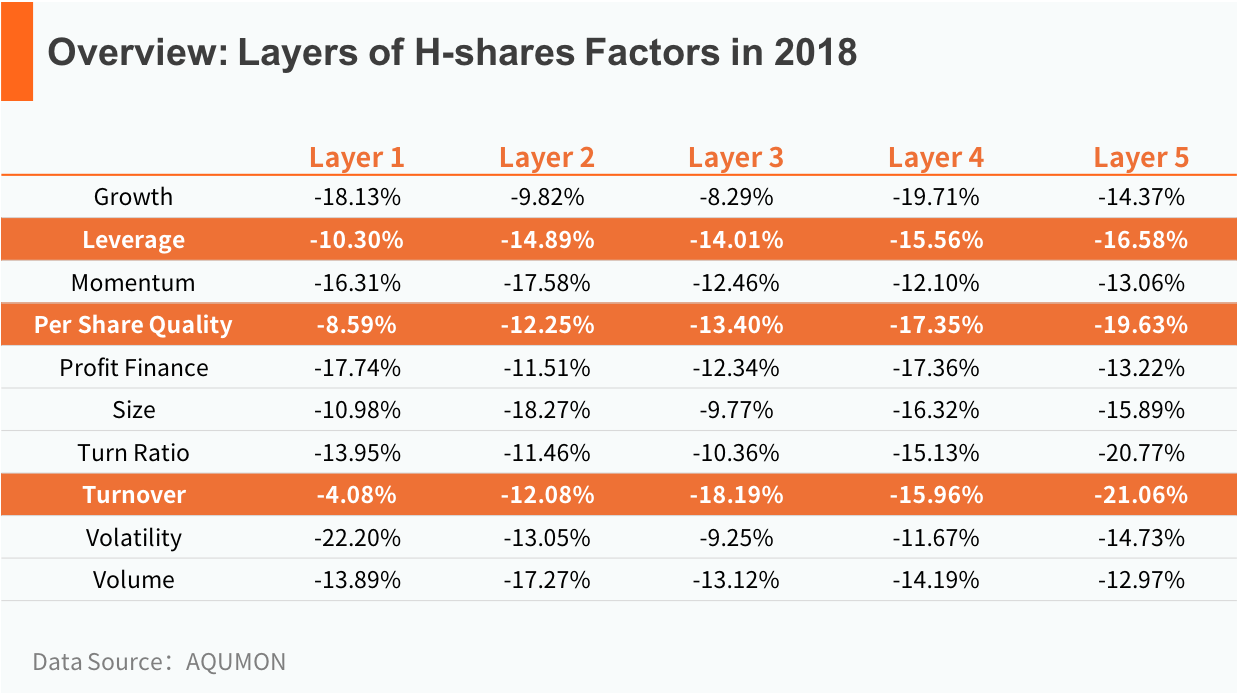
Although the stock market styles were volatile in 2018, when we look at the entire year, the most effective factors for A-shares were growth factors, liquidity factors, and quality factors. In general, lower growth (higher value), lower liquidity, and higher quality stocks performed better. As for the Hong Kong stock market, leverage factor, earnings per share factor and turnover factor proved to be most effective.
What about the style of the market in 2019?
Since the beginning of the year, within only 13 trading days, the HSI has risen by more than 1800 points, with an increase of 7.38%.

We compare the correlation between the factors of Hong Kong stocks and stock returns in 2018 and 2019. From the graph, we can see that half of the factors’ styles have changed, as indicated in the orange cells. From the beginning of 2019, the market style is relatively aggressive: stocks with high turnover, high volatility, and high liquidity are outperforming. Whether these factors will continue to lead to outperformance is a question to which we do not know the answer, but we are continuously monitoring the market.
Conclusion
Many stock investors have their own investment styles: some people believe small-cap stocks can bring the huge excess returns, while others enjoy the stable returns provided by large-cap stocks; some are optimistic about growth stocks, while others prefer owning value stocks. However, the stock market is highly changeable, and the styles are unpredictable. Sticking to a single investment style can lead to large underperformance in certain periods.
In 2018, our stock picking model had excellent performance. The AI China Alpha Strategy had 23% excess return relative to the CSI 300 index; the pure long AI Hong Kong Alpha Strategy generated 17% excess return relative to the Hang Seng Index. Our hedged AI Hong Kong Alpha Strategy provided 10.78% in absolute return in 2018.
The ability for our AI algorithm to monitor and analyze market style is not possible with human investment managers. Although consistently correct prediction is not feasible, our factor model has in 2018 proved to be very effective in capturing style changes in the market and earning excess returns. In 2019, we continue to optimistic.
Disclaimer
Viewers should note that the views and opinions expressed in this material do not necessarily represent those of Magnum Research Group and its founders and employees. Magnum Research Group does not provide any representation or warranty, whether express or implied in the material, in relation to the accuracy, completeness or reliability of the information contained herein nor is it intended to be a complete statement or summary of the financial markets or developments referred to in this material. This material is presented solely for informational and educational purposes and has not been prepared with regard to the specific investment objectives, financial situation or particular needs of any specific recipient. Viewers should not construe the contents of this material as legal, tax, accounting, regulatory or other specialist of technical advice or services or investment advice or a personal recommendation. It should not be regarded by viewers as a substitute for the exercise of their own judgement. Viewers should always seek expert advice to aid decision on whether or not to use the product presented in the marketing material. This material does not constitute a solicitation, offer, or invitation to any person to invest in the intellectual property products of Magnum Research Group, nor does it constitute a solicitation, offer, or invitation to any person who resides in the jurisdiction where the local securities law prohibits such offer. Investment involves risk. The value of investments and its returns may go up and down and cannot be guaranteed. Investors may not be able to recover the original investment amount. Changes in exchange rates may also result in an increase or decrease in the value of investments. Any investment performance information presented is for demonstration purposes only and is no indication of future returns. Any opinions expressed in this material may differ or be contrary to opinions expressed by other business areas or groups of Magnum Research Limited and has not been updated. Neither Magnum Research Limited nor any of its founders, directors, officers, employees or agents accepts any liability for any loss or damage arising out of the use of all or any part of this material or reliance upon any information contained herein.