

New Perspective on Investing – the RSJ Factor
Written by AQUMON Team on 2020-07-03
In the world of quantitative investing, one of the most fundamental concepts that underlie this discipline are factors (A factor is a characteristic inherent to a type of financial asset that explains why they have different risk and return values from the market). Among the most common factors investors look out for include value, volatility and momentum.
These very factors lay the foundation of today’s quantitative investment strategies; they are constructed by studying the relationship between factors and stock returns to predict future market movements. While investors use factors to optimise established investment strategies, they also seek to unearth new factors to take advantage of better investment opportunities. New factors that possess greater predictive power or low correlations with existing factors can lead to previously undiscovered alpha gains.
Ray Dalio, founder of Bridgewater Associates, once stated: “I’ve discovered that if I have 15-20 good, diversified, and uncorrelated return streams, I can greatly reduce my risk without reducing my expected return. I call this the holy grail of investing.” Dalio’s “Holy Grail”, the sweet spot between diversification and low correlation, perfectly prefaces a newly discovered low-correlation factor called the Relative Signed Jump (RSJ).
The RSJ factor was developed by Bollerslev, who has made outstanding contributions to the field of economics through his work on financial market volatility and the GARCH financial model. His 2017 paper (Bollerslev, T., Li, S. Z., & Zhao, (B. (2017)) fills the gap between predicting the direction of stock returns with high-order moments. The following questions seek to unearth the uniqueness of this factor and its ability to accurately predict stock market movements:
(1) What is the RSJ factor? Why does it have superior predictive abilities?
(2) How is the RSJ factor constructed?
(3) How well can the RSJ factor predict market movements based on empirical data?
Risk Preference vs. Aversion? Risk cannot be generalized
Investing is all about balancing one’s risks and expected returns. The amount of risk one is willing to take for a potential monetary outcome is called risk preference; some investors’ primary goal is to gain the highest investment returns (which comes with greater risk), while others simply seek to minimise their losses (which comes with lower risk).
Most people are reluctant to take on high levels of risk, yet they still seek the highest possible returns. This paradox often leads investors to make somewhat contradictory investment decisions. In finance, the classical assumption is that investors are rational agents who exhibit risk aversion. In practice, however, investors actually display irrational loss aversion; exhibiting risk-seeking behaviour when faced with losses and risk-aversion when faced with gains.
Isolating and observing this behaviour in high-frequency data is difficult, but Bollerslev’s RSJ factor does just this by considering positive and negative returns separately.
Bollerslev constructed the RSJ factor by calculating the variances of both positive and negative returns, then finding the difference to focus solely on a stock’s price “jump” after an event. The RSJ removes overall volatility.
The key to factor building: Capturing the directional change in stock prices
To develop his model, Bollerslev (2017) used a range of 5-minute frequency data from 4 January 1993 to 31 December 2013, giving him N = 78 sets of data a day (assuming that a day of trading is 6.5 hours long).
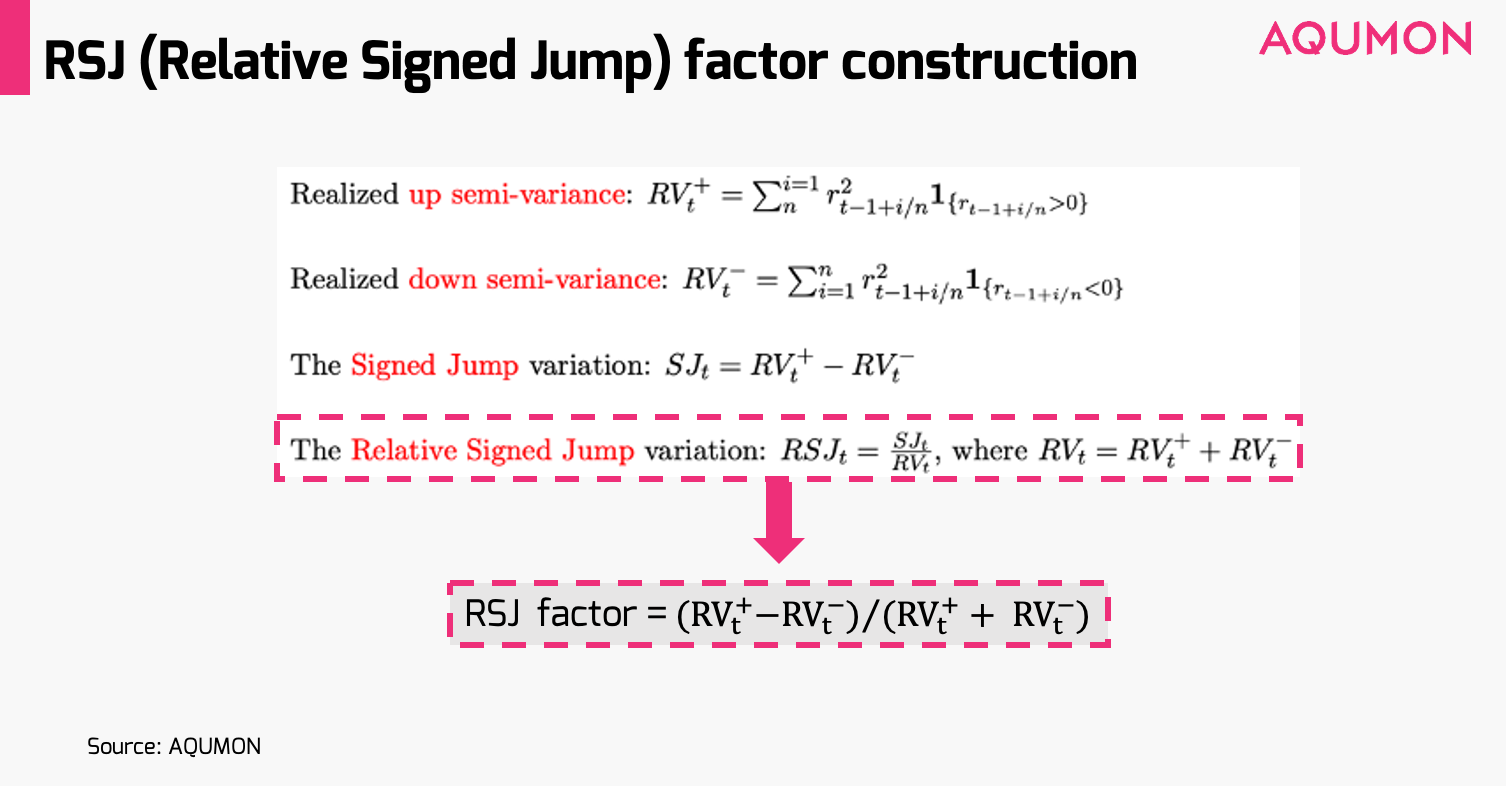
Bollerslev defined the top half of the variance as the return when the rate of return is greater than zero sum squared, while the bottom half variance is defined as the squared sum of returns when the rate of return is less than zero. The difference between the two leads to the Signed Jump (SJ) variation. Total volatility is removed by dividing the SJ by the squared sum of all returns, which results in the RSJ factor with a value between +1 and -1. In other words, the RSJ isolates for a stock price “jump” minus the systemic volatility that exists in financial markets.
An examination of the RSJ’s construction process brings to light its fundamental insight: the directional nature of the stock price “jump”. What is interesting to note is that the RSJ is correlated to the different risk appetites of investors when faced with upward and downward stock price movements.
Empirical Results: There may be insider information that influences stock price jumps.
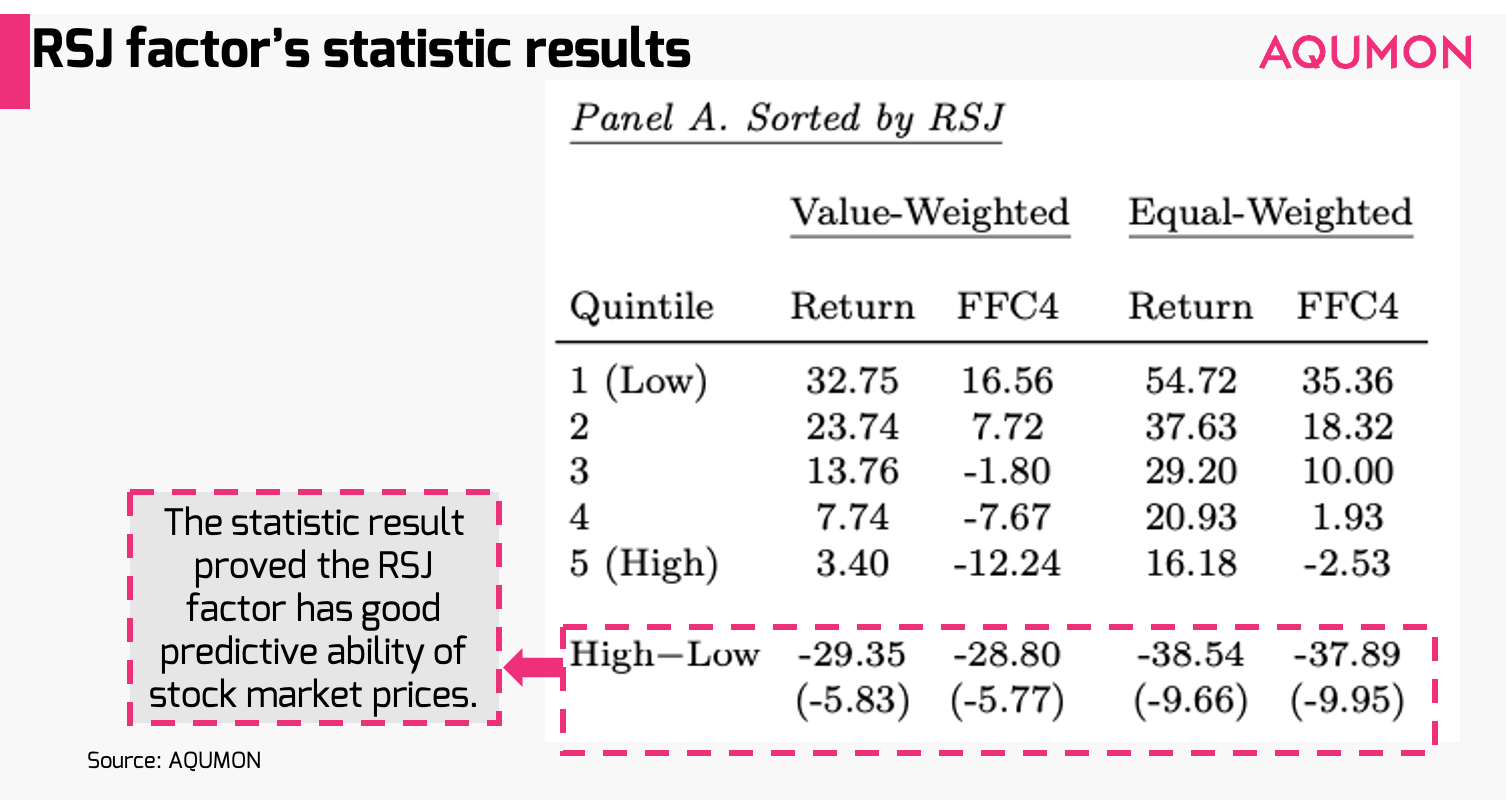
The chart below (Panel A) shows that the RSJ and average future realised returns are negatively correlated at a statistically significant level. This illustrates that the RSJ factor is a good predictor of stock market prices.
So how can we use the RSJ factor in real life? Believe it or not, the RSJ can be used to examine the relationship between company profit announcements and their resulting share price movements.
The chart below depicts the relationship between announcements affecting company profits and RSJ (e.g. news containing positive/negative profits). Bollerslev calculates the average RSJ and cumulative RSJ for the 12 weeks before and after the message respectively. Positive profits are outlined with the dashed line, while negative profits are solid.
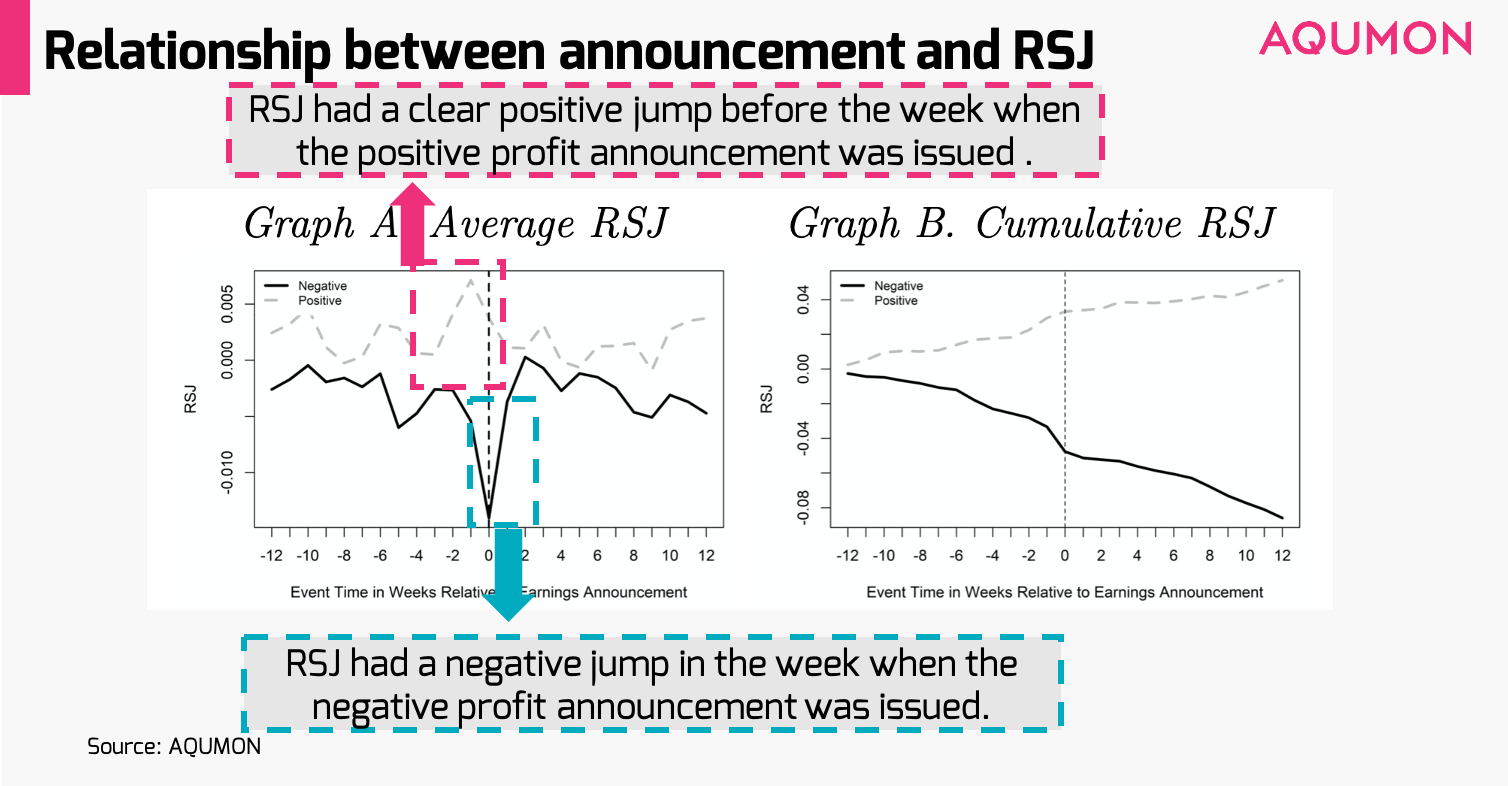
It is clear that the RSJ had a very clear positive jump the week before the announcement containing the positive profit news; and in the week when the negative profit announcement was issued, the RSJ was negative.
What is interesting to note is that the positive RSJ jump a week prior to the positive profit news would lead us to believe that the market had received insider information prior to the public announcement. The trend shown by the RSJ factor also confirms this conjecture. The cumulative RSJ performance also characterizes this same trend before and after the announcement.
The RSJ also illustrates how investors will sometimes unconsciously overreact to news, such as when there are extreme price movements or when arbitrage behaviour is restricted. Therefore, the RSJ factor would yield better predictive power for smaller company stocks, company stocks with volatile stock prices and illiquid company stocks.
In addition to the two points mentioned above, Bollerslev (2017) also performs a very detailed analysis of his empirical results, which contributes greatly to research of alpha strategies in general. This paper also compares the kurtosis factor with the RSJ, which is another factor that also considers the direction of stock prices and concludes that the RSJ factor is more representative than kurtosis and all factors outlined in his paper. If you are interested, you are welcome to read the original literature.
Reference:
Bollerslev, T., Li, S. Z., & Zhao, B. (2020). Good volatility, bad volatility, and the cross section of stock returns. Journal of Financial and Quantitative analysis, 55(3), 751-781.
About us
As a leading startup in the FinTech space, AQUMON aims to make sophisticated investment advice cost-effective, transparent and accessible to both institutional and retail markets, via the adoptions of scalable technology platforms and automated investment algorithms.
AQUMON’s parent company Magnum Research Limited is licensed with Type 1, 4 and 9 under the Securities and Futures Commission of Hong Kong. In 2017, AQUMON became the first independent Robo Advisor to be accredited by the SFC.
AQUMON’s investors include Alibaba Entrepreneurs Fund, Bank of China International and HKUST.
Disclaimer
Viewers should note that the views and opinions expressed in this material do not necessarily represent those of Magnum Research Group and its founders and employees. Magnum Research Group does not provide any representation or warranty, whether express or implied in the material, in relation to the accuracy, completeness or reliability of the information contained herein nor is it intended to be a complete statement or summary of the financial markets or developments referred to in this material. This material is presented solely for informational and educational purposes and has not been prepared with regard to the specific investment objectives, financial situation or particular needs of any specific recipient. Viewers should not construe the contents of this material as legal, tax, accounting, regulatory or other specialist of technical advice or services or investment advice or a personal recommendation. It should not be regarded by viewers as a substitute for the exercise of their own judgement. Viewers should always seek expert advice to aid decision on whether or not to use the product presented in the marketing material. This material does not constitute a solicitation, offer, or invitation to any person to invest in the intellectual property products of Magnum Research Group, nor does it constitute a solicitation, offer, or invitation to any person who resides in the jurisdiction where the local securities law prohibits such offer. Investment involves risk. The value of investments and its returns may go up and down and cannot be guaranteed. Investors may not be able to recover the original investment amount. Changes in exchange rates may also result in an increase or decrease in the value of investments. Any investment performance information presented is for demonstration purposes only and is no indication of future returns. Any opinions expressed in this material may differ or be contrary to opinions expressed by other business areas or groups of Magnum Research Limited and has not been updated. Neither Magnum Research Limited nor any of its founders, directors, officers, employees or agents accepts any liability for any loss or damage arising out of the use of all or any part of this material or reliance upon any information contained herein.