

US Technology Sector Continues to See Growth
Written by Ken on 2020-08-06
With Europe posting disappointing economic growth numbers late last week we continued to see a strong divergence in returns between US stocks (partly lead by the strength in US technology stocks) and their European counterparts. The US’ S&P 500 was +1.73% last week and +1.25% year to date. In comparison the Euro Stoxx 50 was -4.12% last week and -15.24% year to date. Current outperformance of broad US vs European stocks is +16.49% year to date. China markets were also driven by the technology sector and policy support saw the CSI 300 +4.20% last week and +14.60% year to date. Hong Kong’s Hang Seng Index was relative mute last week -0.45% last week.
AQUMON’s diversified ETF portfolios were +0.11% (defensive) to +1.86% (aggressive) last week and +2.24% (defensive) to +1.59% (aggressive) year to date. All AQUMON’s ETFs portfolios regardless of risk profile are now positive year to date. Portfolio drivers last week were Chinese technology (+6.59%) and US technology (+3.69%) leading the way. Gold continued to see upward support +3.83% last week. Weakest performer was energy stocks -3.95%.
With the continued strength in technology stocks, this week our focus will be looking more deeply to see if US technology stocks are in a bubble, the prospects of Hong Kong listed tech stocks and also updating everyone on the US stimulus talks.
US technology sector continues to see growth but it isn’t cheap either.
It’s no doubt that US technology stocks continue to lead global financial markets during this volatile COVID environment. When comparing the Nasdaq 100 versus the S&P 500 Index you can see a vast +19.60% outperformance year to date in 2020:

The trillion dollar question is...are technology stocks, particularly mega caps like FAAMG (Facebook, Amazon, Apple, Microsoft and Google) in a bubble? Our short answer is ‘likely not’ but it is important to point out that they aren’t particularly cheap either. There are 2 reasons we come to this conclusion:
1) Valuations are high but not at bubble level: This is the first litmus test. The US technology sector currently trades at around 25.4x forward price to earnings (PE). When looking at the Nasdaq 100’s historical PE we see we are still far below peak levels (~70x) during the dot com bubble and more closer to pre or post bubble level valuations.
Some investors may argue that forward PE is a ‘lagging’ indicator and looking at the dot com era valuations peaked ‘after’ the bubble burst. Why? If you look closer, part of the reason for that was because US technology company earnings were falling faster than their stock prices (PE is the stock price divided by forward looking earnings) creating a situation whereby PE valuations remained high while the stock price was plummeting. At least for now, this is not the case here so we think current valuations accurately reflect where US technology companies are.
2) US technology stocks continue to deliver solid earnings: This is the secondary litmus test and more indicative of the current mega cap technology space. Those of you who’ve been following our blog know we mentioned back in mid-July (before earnings season) that many US companies will beat their earnings expectations primarily because expectations are set quite low this quarter. The numerical evidence supports this. According to Factset, 84% of S&P 500 companies who reported as of July 31st have beat earnings expectations (the highest since Factset started tracking this metric in 2008). So how did FAAMG (Facebook, Amazon, Apple, Microsoft and Google) stocks do?
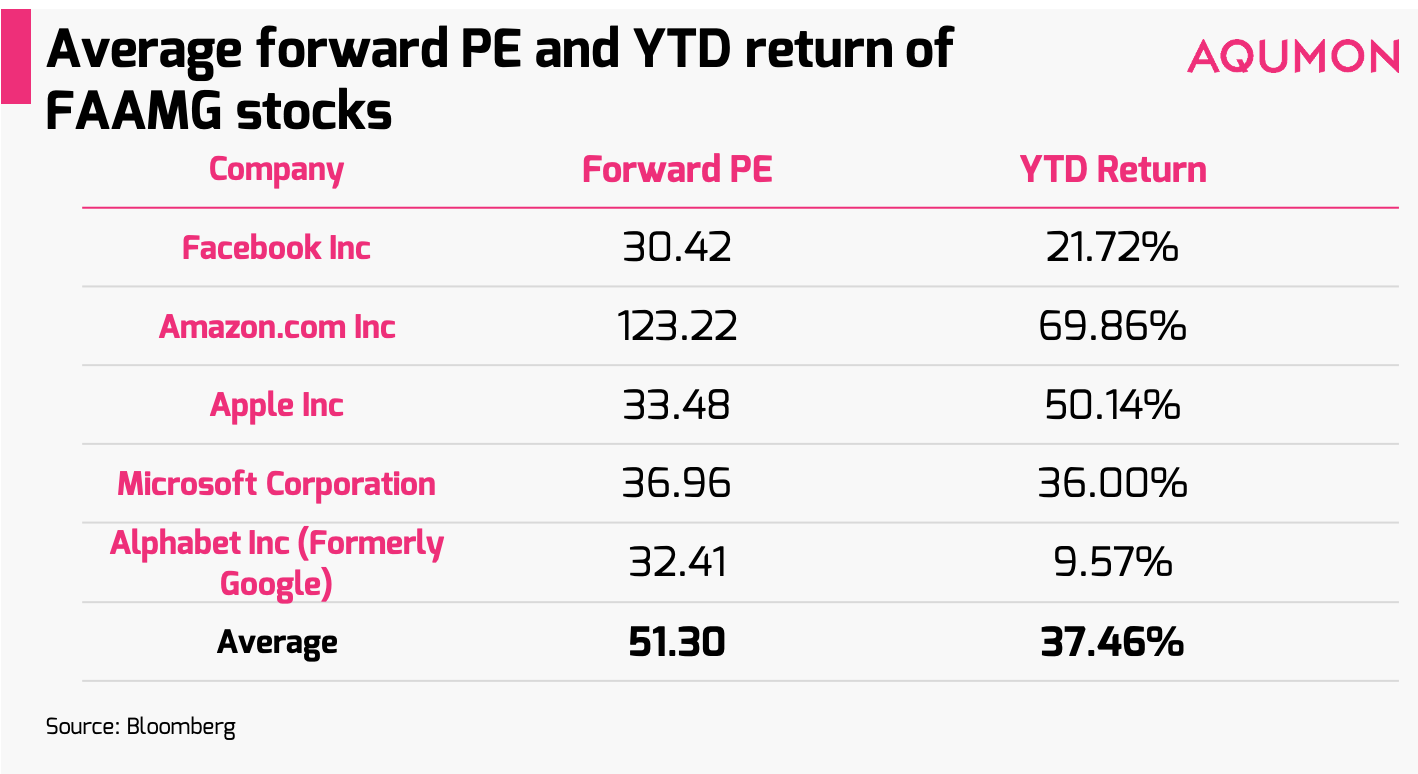
Facebook, dealing with boycotts from advertisers along with cutbacks in advertising spend, still saw ad revenues increase 10% year on year. Amazon, one the big winners of the COVID economy, saw revenues increase 41% in Q2 (fourth straight quarter of growth over 40%). Apple’s US$59.7 billion (~HK$462.7 billion) revenue was the highest the company has ever reported in its Q3, up 11% year over year. Microsoft’s booming cloud computing business delivered ~35% of their US$38 billion (~HK294.5 billion) revenue generated in Q2. The minor blemish was Alphabet (formerly Google) who posted a decline in advertising revenues for the first time in its history for Q2. But each segment of its ad business did outperform analyst expectations. So the majority of FAAMG companies didn’t just ‘beat’ but smashed top line earnings estimates proving they are not only able to survive but actually thrive during this COVID pandemic economy.
Furthermore, when looking at forward looking guidance for Q3 and Q4 earnings expectations are relatively more positive. All in all, given the current economic climate, this is more than solid news from these tech mega caps and continues to suggest that investment into these names are justified. It would have been a big red flag if earnings was poor along with how crowded (meaning held by an unusually large amount of investors) these names are.
Even though there is positive news there are pitfalls investors should be aware of:
1) “Tech” stocks are not cheap and driving up valuation for other sectors: Although not yet in bubble territory, you pay for what you get in terms of these tech mega caps with an average PE ratio of 51.30 (but that number is largely driven up by Amazon Inc’s valuation):
Another thing to note is these mega caps are also driving up valuation for non information technology sectors in the S&P 500. How so? Although almost all investors would consider FAAMG “tech names” half of these names are not classified under the “information technology” sector when looking at the S&P 500. So investors should be aware when investing into other sectors that FAAMG names are also impacting valuations and returns of both the communications sector (includes Facebook and Google) and the consumer discretionary sector (includes Amazon). So clearly know what you are investing into.
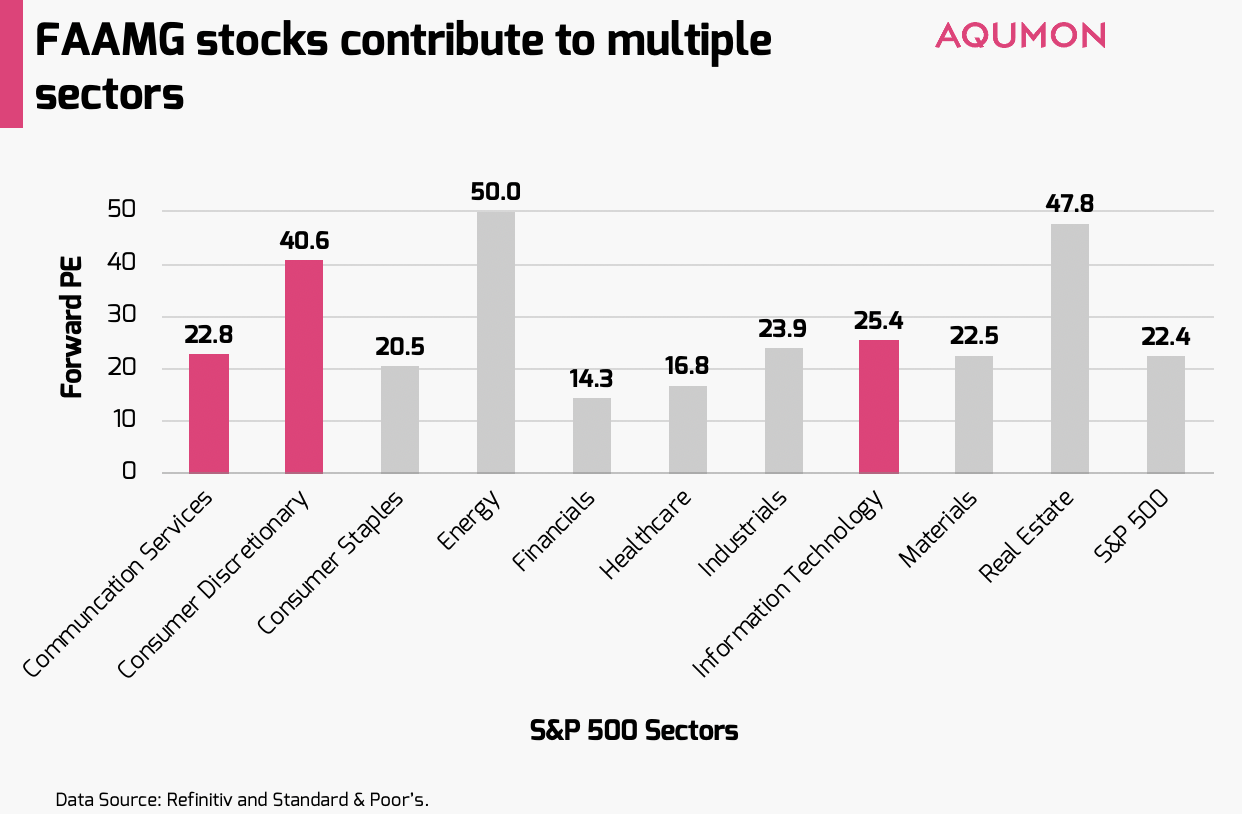
2) Watch out for the rotation by investors into value: Although technology names continue to grind up returns wise, we suggest keep a close eye on when others investors start rotating into value sectors (like financials) who have stayed muted during much of this pandemic period. The US financials sector currently has a forward PE that is 43% lower than the information technology sector. Much like how the 5 FAAMG names grew considerably in market capitalization in 2020 to take up collectively 22.77% of the weighting of the S&P 500 Index, investors may also unknowingly become more and more concentrated in their positioning as this sector and its names become more crowded. This could pose risky for investors if we see a sudden rotation by investors out of technology stocks into more cheaply valued sectors.
The US tech sector as we mentioned earlier is likely not in bubble territory and continues to deliver solid earnings to justify its current valuation (but it isn’t cheap). Furthermore investors should beware of a potential upcoming rotation out of this sector given how crowded it is. Staying properly diversified and rebalancing your portfolios regularly is suggested in this current market environment.
On a AQUMON related note, we have upgraded our investment platform this week to support clients buying multiple exchange traded funds (ETF) portfolios. Particularly for clients who may have invested in our US ETF portfolios who may want to gain more HK/China regional exposure or diversify further to manage downside risk better can consider looking into our HK ETF portfolios (and vice versa). This is also paving the way for us to offer our clients an all-bond ETF income-orientated portfolio and multiple thematic stock portfolios later this year. Let us know what you think of the upgrade.
Chinese technology names also seeing major uplift
Chinese major technology names listed in Hong Kong are outperforming broad markets recently as well. If we use the Hang Seng Tech Index as a proxy against the Hang Seng Index we see a +9.37% outperformance in just the past 8 trading days since its launch last Monday:
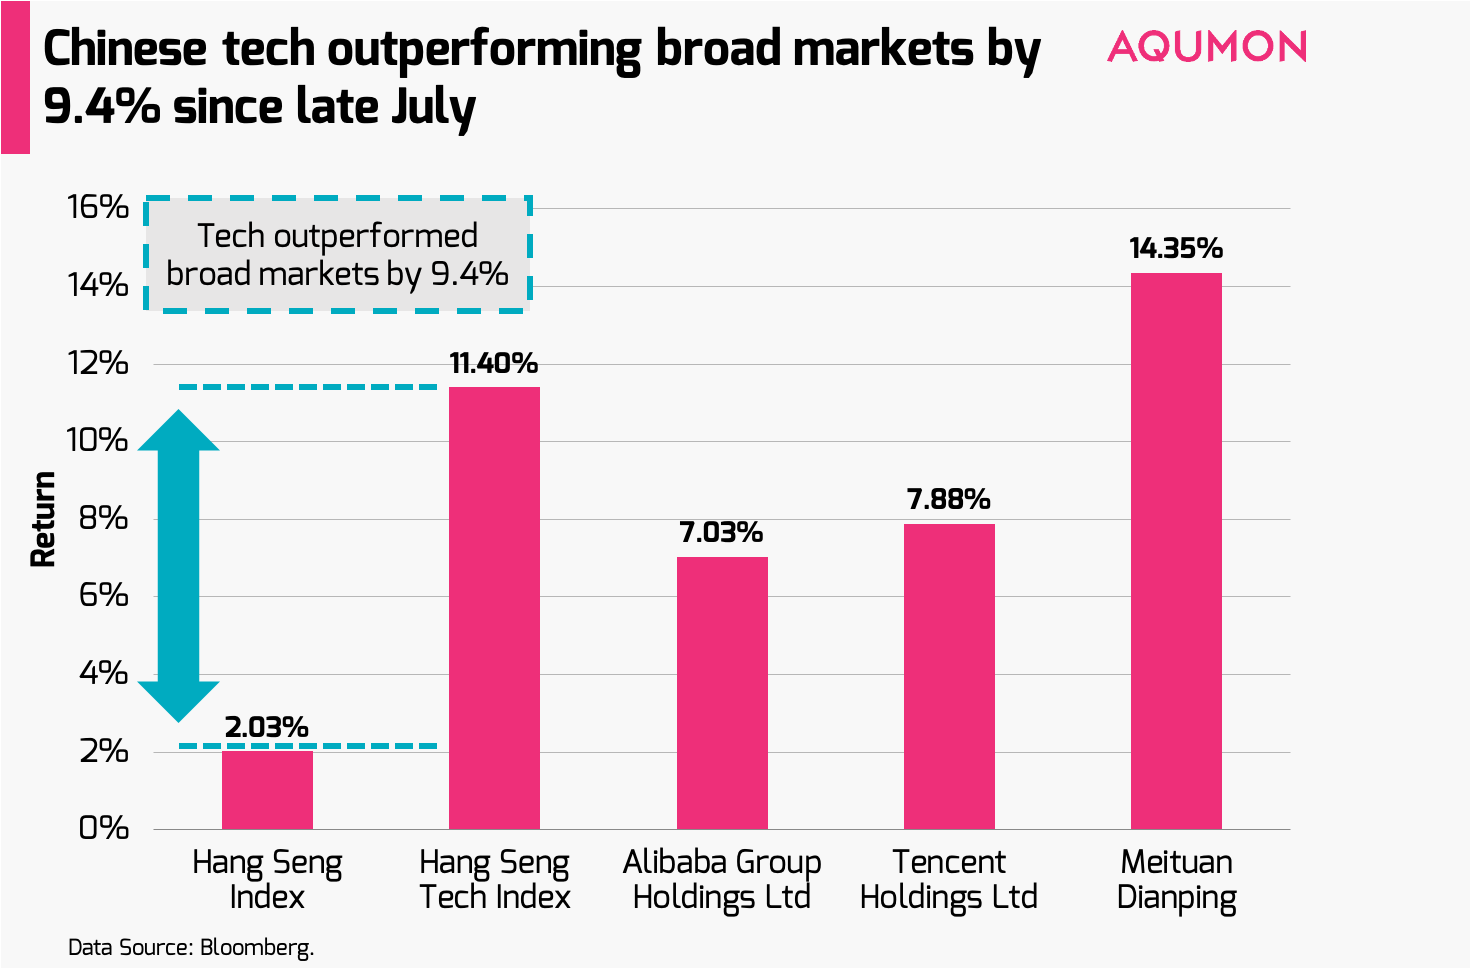
The index tracks the largest 30 technology stocks listed in Hong Kong. This outperformance is in part led by similar investor preference in local tech giants ATM (Alibaba, Tencent and Meituan-Dianping) who are up +7.03%, +7.88% and +14.38% in the same 8 trading days. The secondary reason for outperformance is policy and company-driven. Current local investor belief is with the US putting pressure on the Chinese tech sector that this will be followed by further policy support for the sector by the Chinese government. Furthermore in the case of Tencent, the stock price was driven up this week by talks of Tencent creating a Twitch-like (video game streaming platform where users watch esports) with potential consolidation with Douyu and Huya (China’s most popular video game streaming sites).
Looking at the medium to long term we find this recent development of more Chinese tech giants listing in Hong Kong along with more ETFs and funds launching and tracking this sector, positive for local investment markets. Why?
Logically this is supportive fund inflows wise both from mainland and overseas investors. Mainland investors who could not easily access these Chinese tech giants (since they were listed on the Nasdaq) can now invest in them more easily via Hong Kong’s Stock Connect Southbound channel. International money managers looking for regional tech exposure may also shift more funds to the Hong Kong market. In the long run this may reduce turnover for the Nasdaq with the main beneficiary being the Hong Kong stock exchange. In a year with political tensions being high, this might turn out to be a positive catalyst for Hong Kong-listed tech stocks.
Final few days to reach an agreement on the next US stimulus package
As we mentioned last week, August 7th is the last day for both US parties to reach an agreement on the US stimulus package before a scheduled month-long recess until September 8th. Although both Democrats and Republicans agree there is a need for a second US$1,200 (~HK$9,300) stimulus check, they have not made major progress this past week as the deadline approaches. The biggest hurdle seems to be agreeing on the size of the stimulus package. The gap between the 2 parties is reportedly over US$2 billion (~HK$15.5 billion). The Republican party earlier offered a US$1 billion (~HK$7.8 billion) proposal while the Democrat party believes a US$3 billion (~HK$23.3 billion) package, similar to the size of the stimulus package offered in March, is warranted. The market has likely priced this in so a delay would bring unwarranted short term weakness back to financial markets. All eyes will be on the US government to see if they can pass the next round of their proposed stimulus package and how quickly they can provide financial relief to Americans in need.
If you have any questions please don’t hesitate to reach out to us at AQUMON. We’re always happy to help. Thank you again for your continued support for AQUMON, stay safe outside and happy investing!
About us
As a leading startup in the FinTech space, AQUMON aims to make sophisticated investment advice cost-effective, transparent and accessible to both institutional and retail markets, via the adoptions of scalable technology platforms and automated investment algorithms.
AQUMON’s parent company Magnum Research Limited is licensed with Type 1, 4 and 9 under the Securities and Futures Commission of Hong Kong. In 2017, AQUMON became the first independent Robo Advisor to be accredited by the SFC.
AQUMON’s investors include Alibaba Entrepreneurs Fund, Bank of China International and HKUST.
Disclaimer
Viewers should note that the views and opinions expressed in this material do not necessarily represent those of Magnum Research Group and its founders and employees. Magnum Research Group does not provide any representation or warranty, whether express or implied in the material, in relation to the accuracy, completeness or reliability of the information contained herein nor is it intended to be a complete statement or summary of the financial markets or developments referred to in this material. This material is presented solely for informational and educational purposes and has not been prepared with regard to the specific investment objectives, financial situation or particular needs of any specific recipient. Viewers should not construe the contents of this material as legal, tax, accounting, regulatory or other specialist of technical advice or services or investment advice or a personal recommendation. It should not be regarded by viewers as a substitute for the exercise of their own judgement. Viewers should always seek expert advice to aid decision on whether or not to use the product presented in the marketing material. This material does not constitute a solicitation, offer, or invitation to any person to invest in the intellectual property products of Magnum Research Group, nor does it constitute a solicitation, offer, or invitation to any person who resides in the jurisdiction where the local securities law prohibits such offer. Investment involves risk. The value of investments and its returns may go up and down and cannot be guaranteed. Investors may not be able to recover the original investment amount. Changes in exchange rates may also result in an increase or decrease in the value of investments. Any investment performance information presented is for demonstration purposes only and is no indication of future returns. Any opinions expressed in this material may differ or be contrary to opinions expressed by other business areas or groups of Magnum Research Limited and has not been updated. Neither Magnum Research Limited nor any of its founders, directors, officers, employees or agents accepts any liability for any loss or damage arising out of the use of all or any part of this material or reliance upon any information contained herein.