
Stock Chart Reading: A Beginner’s Guide
Written by Catherine & Jobie on 2020-12-18
Everyone wants to master the markets, but investing isn’t just about finding the winning stocks or spotting the right time to sell. There’s more to it. Having a good grasp of the fundamentals is the first step towards success. Chart reading is definitely an invaluable tool you’ll need to navigate in news-driven, volatile markets.
Reading a stock chart can be intimidating at first, but don’t stress – AQUMON is here to help! We have highlighted some key points to make reading charts less confusing for you!
Related: Kickstart Your Finances in 2021!
Related: What to Know about Robo-Advisors & AQUMON
Why use stock charts?
A stock chart is a set of information about a particular company’s stock that generally shows information about price changes, current trading prices, historical highs and lows and et cetera. It tells you most information you need about a stock.
If investing is an exam, then a stock chart is the required reading. You can’t sit an exam without knowing what’s on the textbook. It’s the same case when it comes to investing: you can’t invest without knowing what’s happening with the stock and the market.
3 basic things to keep in mind when reading a chart:
1. Read the chart from right to left
2. Pay attention to the trend line
3. It’s about how the stock reacts to the news, not the news itself
What’s in a chart? 3 key factors to look for in a chart
1. Observe the time and price axes
Every stock chart has two axes: the horizontal axis shows the time period, and the vertical axis shows the price of the stock.
2. Price and Volume
You should look at price and volume together when analysing a stock in order to quantify market sentiment.
3. Look for the trend line
You can glean a good bit of information by looking at the trend line on the chart. There are different lines for different chart styles.
Moving average lines vs Relative strength lines
- Moving average lines
This line tracks the share price movement over a set of time – it tells you if a stock is being enthusiastically supported or aggressively sold by large investors.
- Relative strength lines
This line compares a stock performance to that of S&P 500, one of the major US benchmarks – this line is a quick way to see if the stock is a leader or a lagger in the market.
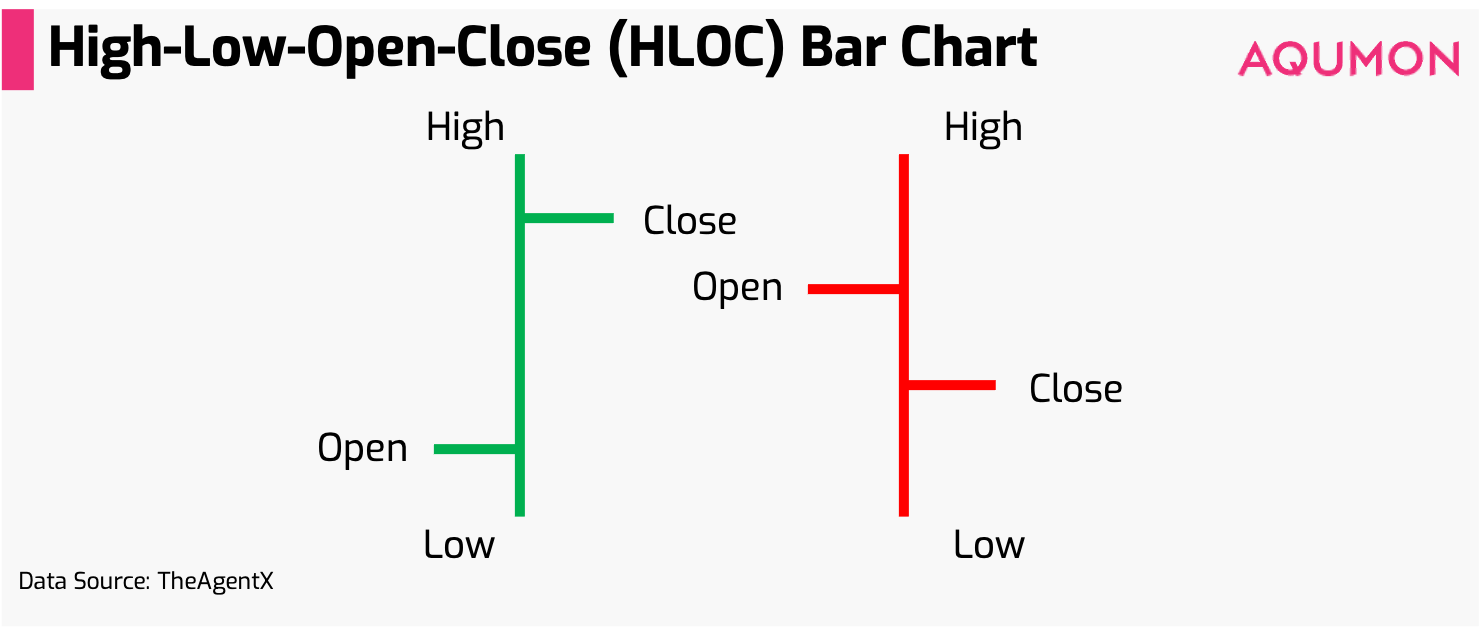
HLOC bar charts vs Candlestick charts
High-low- open-close (HLOC) bar chart tracks a stock’s movement by using its open, high, low and close price.
Candlestick charts are similar to HLOC bar charts, but they are a bit more complex. This type of chart also takes the stock’s open, high, low, and close prices to chart its trend; you read the chart by looking at its colour, body, and wicks.
The colour of the stick is a good indicator of whether the market is bullish or bearish during the period. Typically, green boxes indicate periods when the price of the stock closed higher (bullish) and red boxes when the stock closed lower (bearish) than the previous day.
The wick of the candlestick shows a stock’s highest and lowest price in the given time period: the top wick is the highest and the bottom wick is the lowest.

Related: Your Top Covid-19 Investing Questions Answered
Daily chart vs weekly chart: Which one to use?
Newer investors often wonder the difference between a daily chart or a weekly chart and which one to use.
The short answer to that is both!
The daily chart tells you the price and volume action at specific, time-sensitive moments whereas the weekly chart gives you a longer-term perspective and the stock’s underlying trend.
So be sure to look at both charts to have a better understanding of the stock before taking any actions.
If you want to skip the hassle, AQUMON’s latest product, SmartStock Portfolios, uses our proprietary PowerFactors ® to make stock picking smarter and simpler for you. There are six new thematic portfolios which highlight different areas for investors to choose from. Start investing and let AQUMON do all the work for you!
Related: US Indexes All Beginner Investors Should Know
Related: ETFs: A Beginner’s Guide
About us
As a leading startup in the FinTech space, AQUMON aims to make sophisticated investment advice cost-effective, transparent and accessible to both institutional and retail markets, via the adoptions of scalable technology platforms and automated investment algorithms.
AQUMON’s parent company Magnum Research Limited is licensed with Type 1, 4 and 9 under the Securities and Futures Commission of Hong Kong. In 2017, AQUMON became the first independent Robo Advisor to be accredited by the SFC.
AQUMON’s major investors include the HKUST, Cyberport, Alibaba Entrepreneurs Fund and the Bank of China International's affiliate.
Disclaimer
Viewers should note that the views and opinions expressed in this material do not necessarily represent those of Magnum Research Group and its founders and employees. Magnum Research Group does not provide any representation or warranty, whether express or implied in the material, in relation to the accuracy, completeness or reliability of the information contained herein nor is it intended to be a complete statement or summary of the financial markets or developments referred to in this material. This material is presented solely for informational and educational purposes and has not been prepared with regard to the specific investment objectives, financial situation or particular needs of any specific recipient. Viewers should not construe the contents of this material as legal, tax, accounting, regulatory or other specialist of technical advice or services or investment advice or a personal recommendation. It should not be regarded by viewers as a substitute for the exercise of their own judgement. Viewers should always seek expert advice to aid decision on whether or not to use the product presented in the marketing material. This material does not constitute a solicitation, offer, or invitation to any person to invest in the intellectual property products of Magnum Research Group, nor does it constitute a solicitation, offer, or invitation to any person who resides in the jurisdiction where the local securities law prohibits such offer. Investment involves risk. The value of investments and its returns may go up and down and cannot be guaranteed. Investors may not be able to recover the original investment amount. Changes in exchange rates may also result in an increase or decrease in the value of investments. Any investment performance information presented is for demonstration purposes only and is no indication of future returns. Any opinions expressed in this material may differ or be contrary to opinions expressed by other business areas or groups of Magnum Research Limited and has not been updated. Neither Magnum Research Limited nor any of its founders, directors, officers, employees or agents accepts any liability for any loss or damage arising out of the use of all or any part of this material or reliance upon any information contained herein.