US Stock Portfolios Rebalancing Notes
Written by AQUMON TEAM on 2021-08-24
Why is rebalancing necessary this time?
This rebalancing is a quarterly adjustment of your investment portfolio.
AQUMON SmartStocks® portfolios select stocks based on various themes of the U.S. market, combined with factor scoring algorithms to improve investment performance. We aim to provide clients with a high-yield, low-risk investment portfolio. Recently, many company's mid-year reports indicated that uncertainties in the macroeconomic situations and changes in the regulatory environment have prompted us to adjust the existing portfolio composition and cope with the ever-changing market conditions.
How has the strategy been improved?
After this rebalancing, the new U.S. portfolio strategy is more resilient to market changes. Details are as follows:
1. An uplift to our factor-rating mechanism
We have made several adjustments to the following stock portfolios:
U.S. Global Tech Giants: The current factors of U.S. Global Tech Giants include market value, R&D investment, return on net assets, gross profit, gross profit growth rate, and growth rate of operating income. Compared with the factors in the previous version, we have newly added market value and growth rate of gross profit to select high-quality technology companies with more stable performance.
U.S. Market Leaders: The current factors of the U.S. Market Leaders portfolio include market value, gross profit margin, operating income growth rate, return on net assets, gross profit stability, operating cash flow, and leverage ratio. Compared with the previous version of the factor, we have added a new leverage ratio further to ensure the safety of leading companies in the industry.
Business Winners: The current factors of the portfolio Business Winners include leverage, market value, return on net assets, operating income stability, and operating profit stability. Compared with the elements in the previous version, we have newly added three factors: return on net assets, market value, and operating income stability, replacing gross profit stability with operating profit stability. The COVID-19 epidemic has put many companies in trouble. We believe that companies with good solvency and financial health can also perform well in this challenging period.
Profit Makers: The current factors of portfolio Profit Makers include market value, return on net assets, return on assets, gross profit, operating income, operating profit, gross profit growth rate, and operating income stability. Compared with the factors in the previous version, we have newly added market value, return on net assets, return on total assets, operating income, and operating income stability. We replaced the previous cash profit with operating profit to filter out solid and high-quality companies with high profitability.
Health is Wealth: The current factors of portfolio Health is Wealth include market value, R&D investment, operating income growth rate, operating profit growth rate, and gross profit. Compared with the factors in the previous version, we have retained indicators such as R&D investment (essential to the pharmaceutical industry). We have newly added market value and profit margin to ensure that the selected stocks are excellent with a specific scale and profit growing ability.
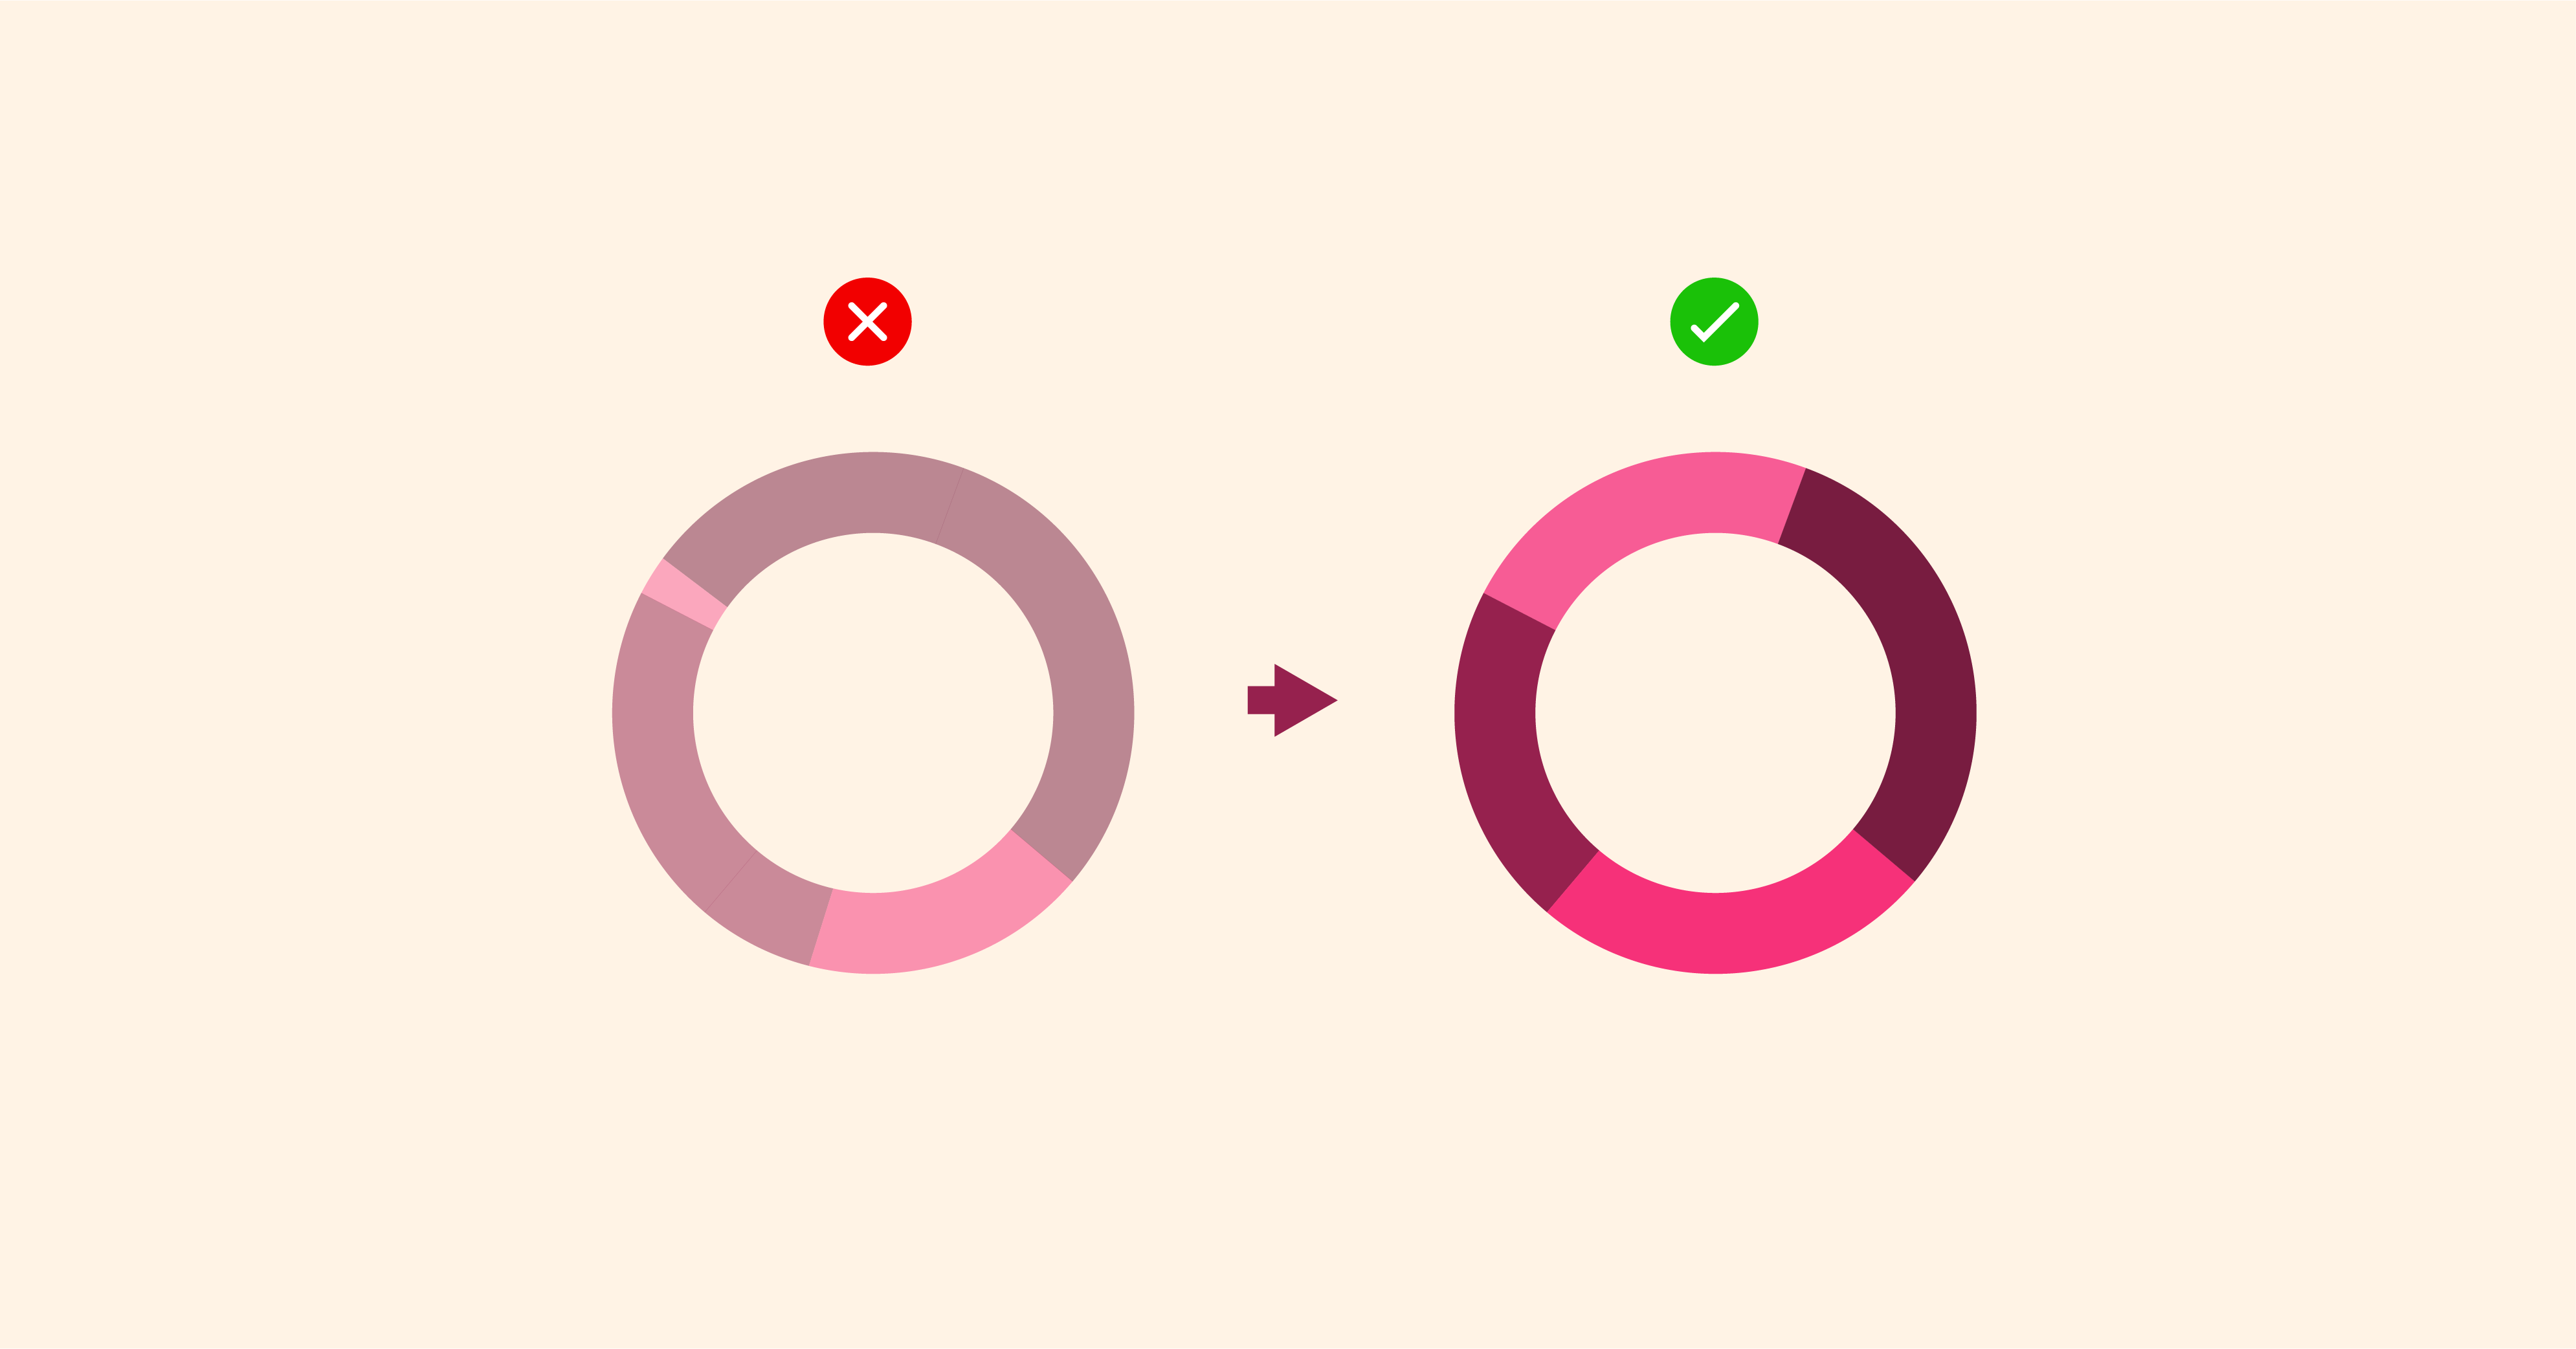
2. Implement industry-neutral weighting
Based on Smart Beta's current positioning, we hope that portfolio performance and benchmark performance will synchronize. As a result, the industry exposure of the U.S. stock portfolio is as consistent as possible with the benchmark to reduce portfolio-specific risk.
3. More in-depth research on fundamentals and industrial reports
We conducted a detailed review of the fundamentals, available research reports, and market sentiment and eliminated stocks with poor performance.
First of all, companies' financial reports were carefully studied and evaluated. Clorox, whose performance is far below expectations in the new financial information, was replaced with Google, with better historical performance and financial report data. Secondly, we also screened companies by market capitalization, such as replacing HRB (a smaller market capitalization) with Estee Lauder (Larger market capitalization and better historical performance). At the same time, we also combined the macro-economic environment to replace PINTEREST, which has benefited from the epidemic but with falling stock prices., with Cisco, which is not sensitive to the epidemic's impact.
4. Set more stringent stock screening conditions
We have set more rigorous stock screening conditions and set more reasonable monitoring conditions for different strategies.
The latest recommended portfolios
1. U.S. Global Tech Giants
From the specific configuration point of view, the global technology giant portfolio retains Apple, Dell, American Netstorage Corporation, Microsoft, Fortinet, Nvidia, Chaowei Semiconductor, Applied Materials, Ram Research, Autumn Semiconductor, Teradyne, and SQUARE. Global leading technology companies have added 18 leading companies in the technology sector, including Amazon, Google, and Facebook. The main drivers for changes are: The improvement of investment strategy, the release of the mid-year financial reports, a more detailed classification of the technology sector
2. US Market Leader
US Market Leader retains 11market-leading stocks, Apple, Google and Facebook, etc., 19 newly added companies include Tesla, Vale, Intuitive Surgery, etc.
3. U.S. Business Winners
U.S. Business Winners retains five companies, including Microsoft, Adobe, PepsiCo, Costco, and Moody's, and adds 25 companies, including Google, Cisco, and Netflix.
4. Profit Makers
Profit Makers retain the seven leading companies that maintain long-term profitability (Apple, Chaowei Semiconductor, Autodesk, Fortinet, Holojet, WILLIAMS SONOMA, and Carroll), with 23 leading newly added profitable stocks such as Dobby and Logitech.
5. Health is Wealth
Health is Wealth retains six healthcare companies: Thermo Fisher Scientific, Forte Pharmaceuticals, VEEVA SYSTEMS, Alain Technologies, American Holding Laboratories, and Quest Diagnostics. Twenty-four leading pharmaceutical companies are added, including Pharmaceuticals, Eli Lilly and Novo Nordisk.
Strategy backtested results
The YTD performance of each portfolio in the past six months after the rebalancing is as follows:
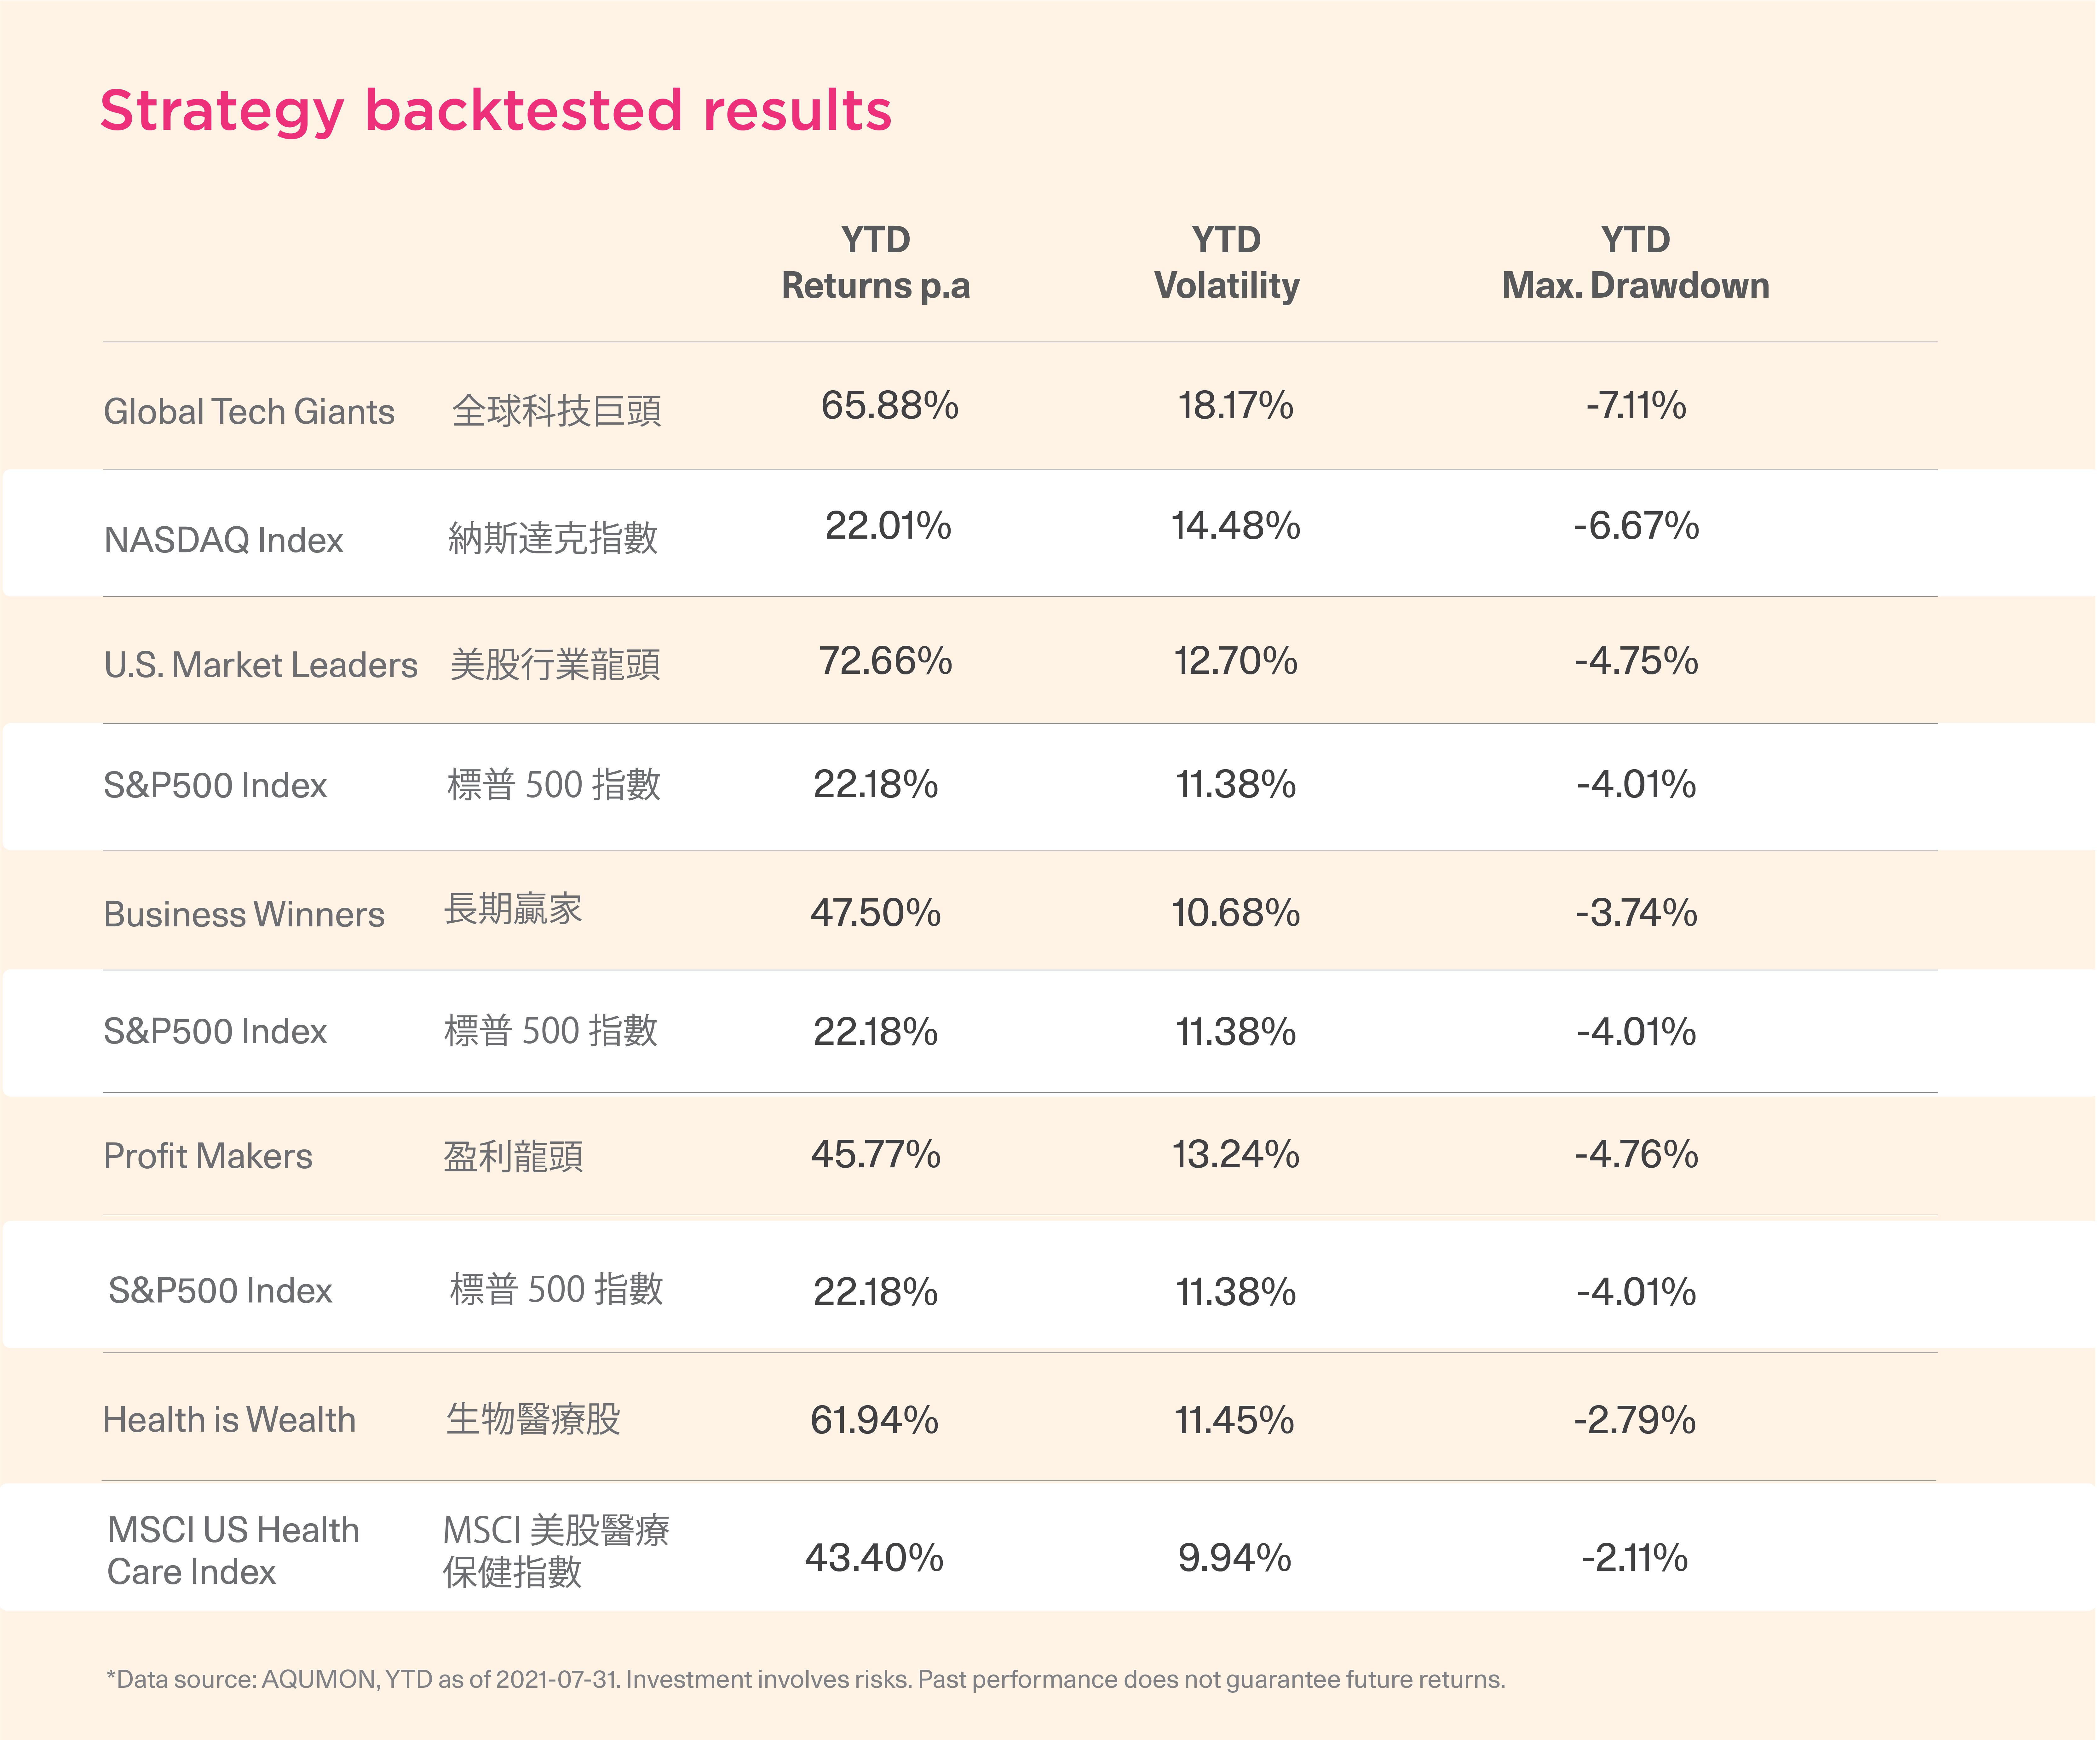
*Note: The white background is the benchmark of the corresponding portfolios.
Judging from the recent 90-day returns, U.S. Global Tech Giants surpassed the Nasdaq index by 8.37%, US Market Leaders surpassed the S&P 500 index by 9.47%, Business Winner topped the S&P 500 index by 5.05%, and U.S. Profit Makers also exceeded the benchmark. The S&P 500 Index is 4.73%, and Health is Wealth surpasses the MSCI U.S. Healthcare Index by 3.37%; meanwhile, the 90- day max. drawdown of our five portfolios is the same as the benchmark. The five U.S. portfolios have a better Sharpe ratio after the adjustment. The Calmar Ratio and other comprehensive indicators have shown our performance is much higher than the benchmark. Our strategy has achieved higher returns and better performance, given the risk level unchanged.
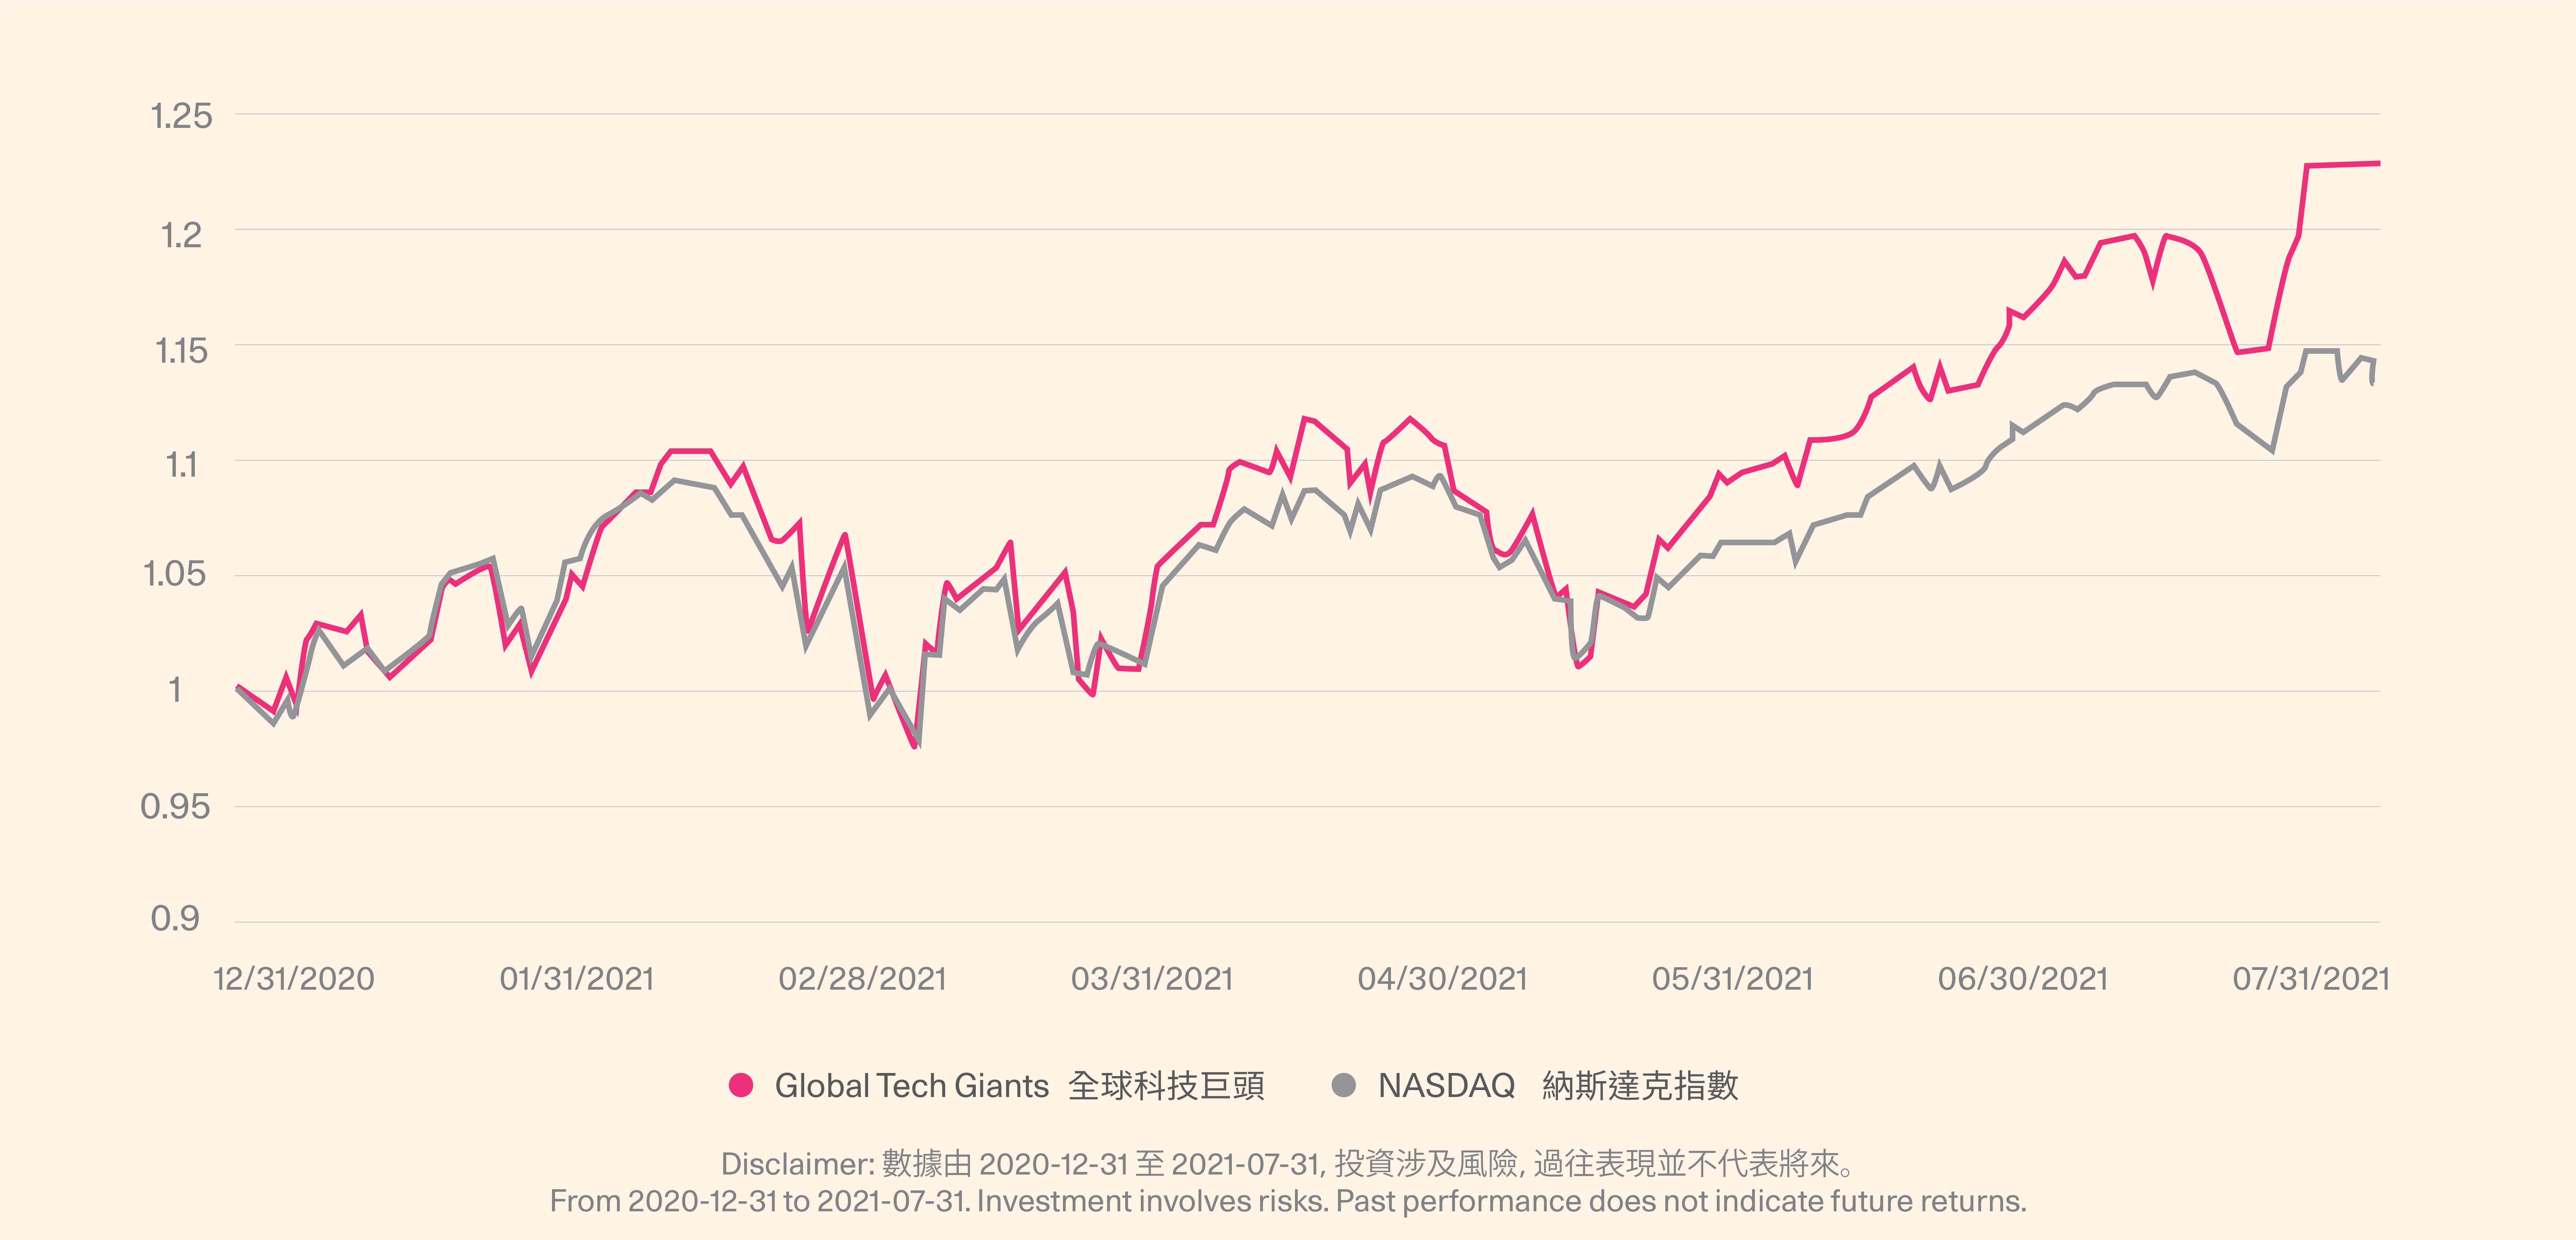
1. Backtested performance of Global Tech Giants
YTD Performance
Whole Sample Period
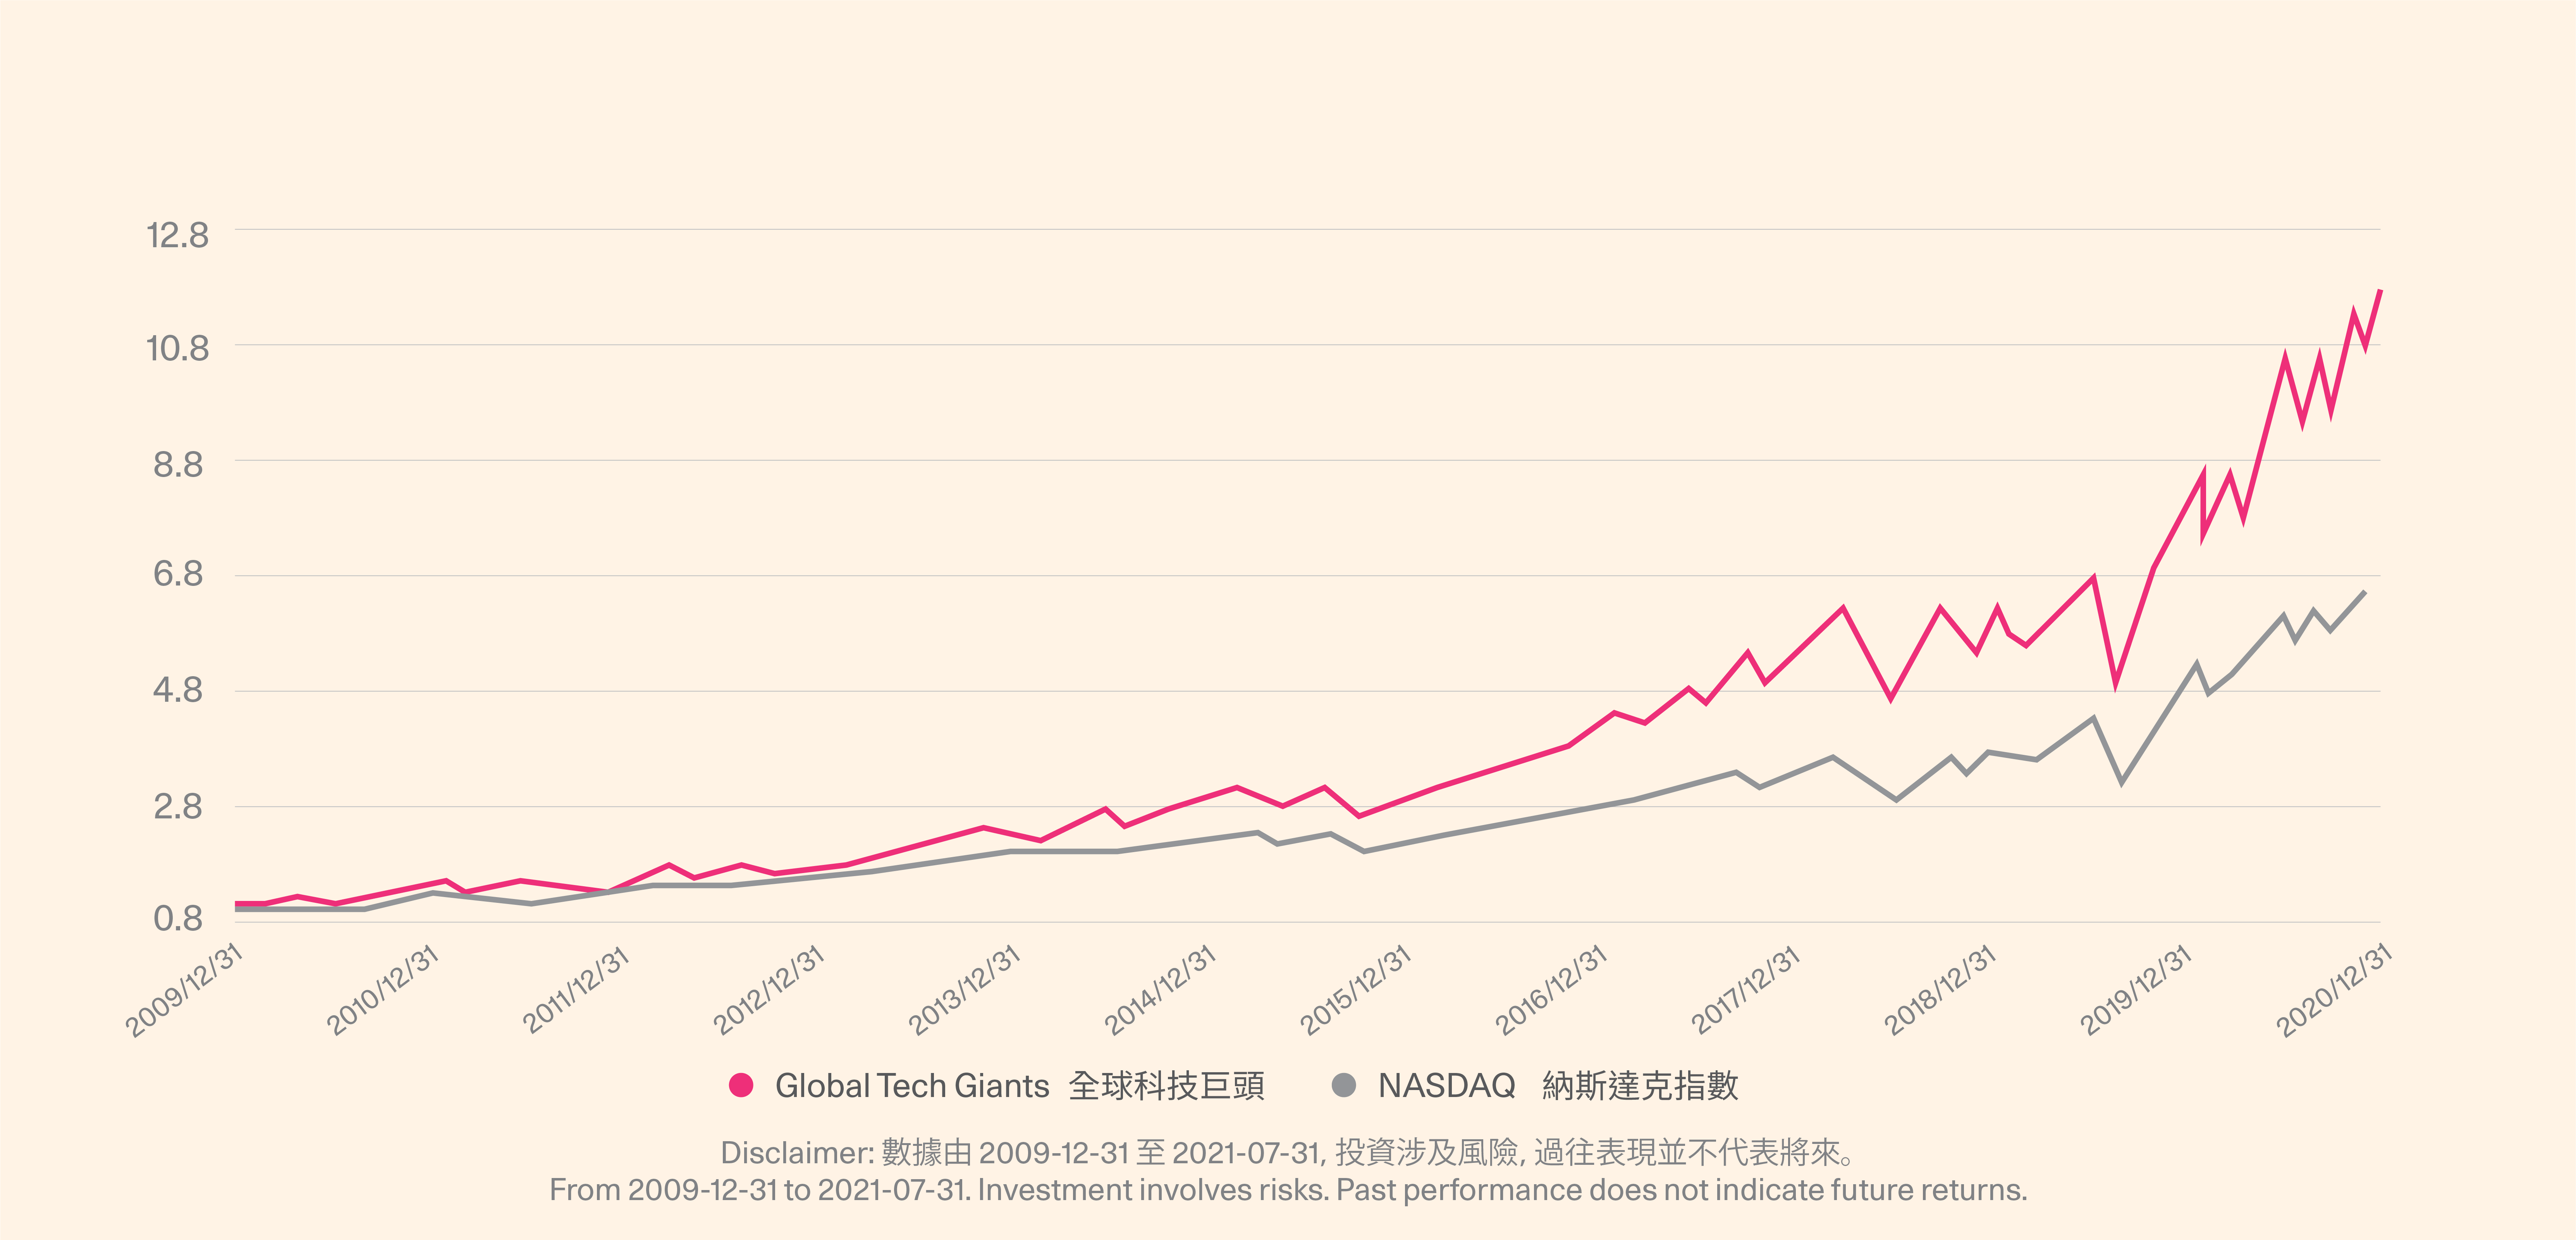
The strategy has shown considerable returns. Since the beginning of the year, the annualized YTD return is 43.97%, surpassing the benchmark Nasdaq Index by 18.82%. The max. drawdown is very close to the benchmark, and the Sharpe ratio is 1.86, which is about 0.54 higher than the benchmark.
The portfolio has a 90-day annualized return of 65.88%, exceeding the Nasdaq index by 43.87%, and the Sharpe ratio is 3.63, given the max drawdown is close to the benchmark.
In summary, our portfolio has performed well and can far exceed the benchmark in short to medium term.
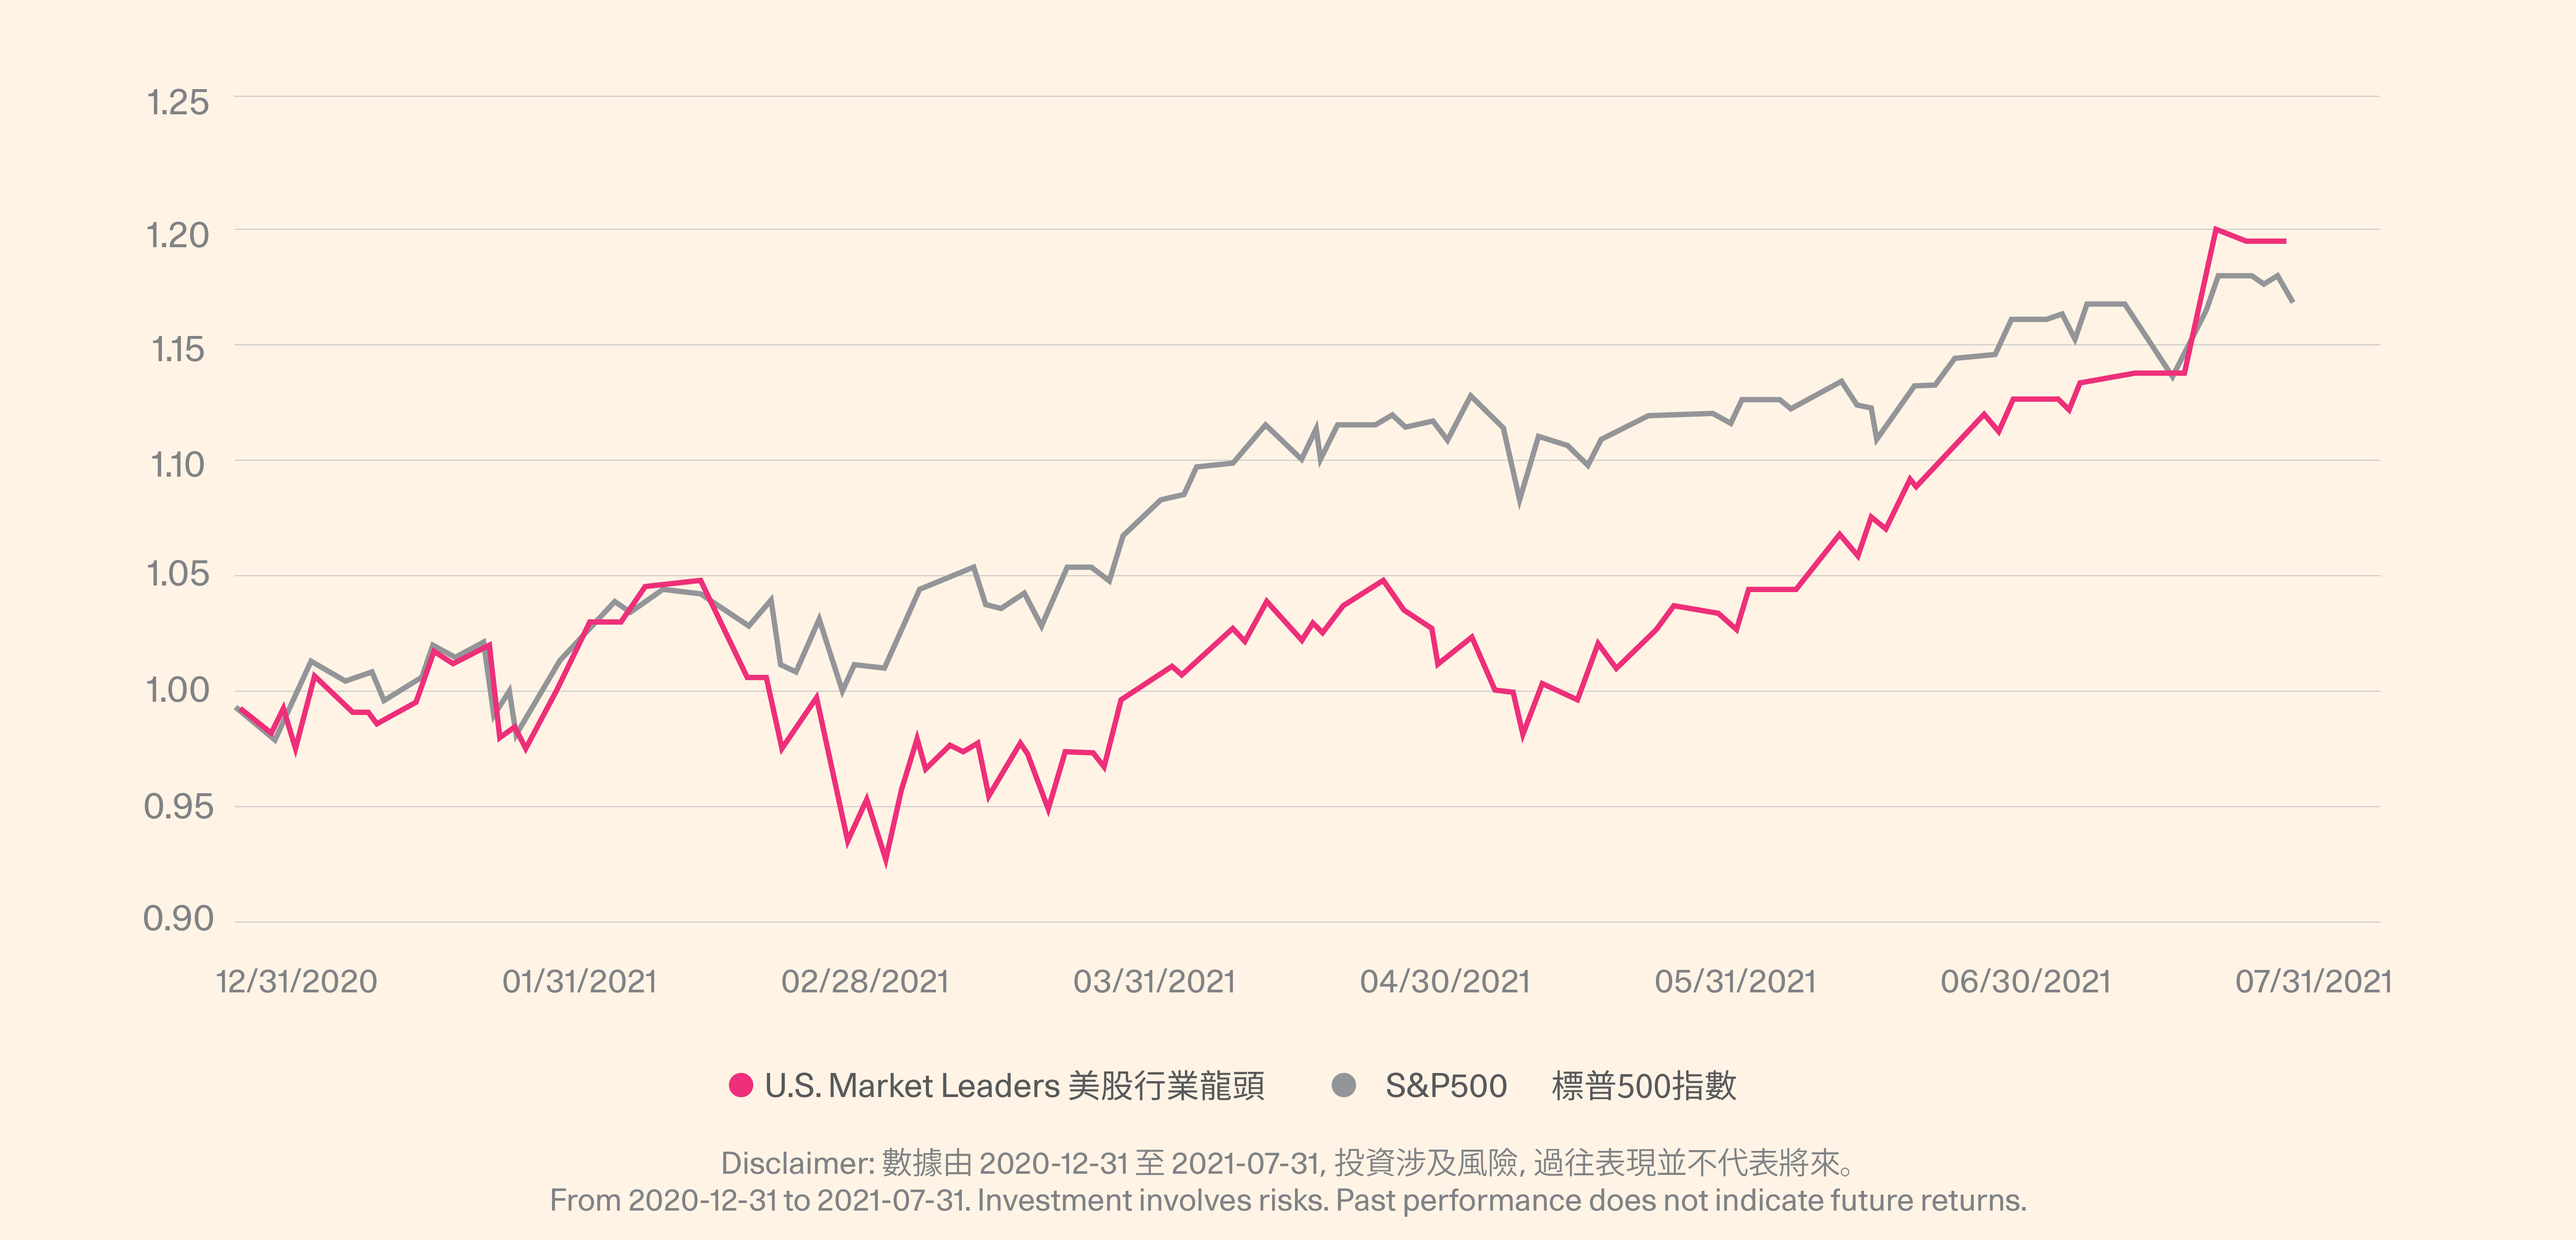
2. Backtested performance of US Market Leaders
YTD Performance
Whole Sample Period
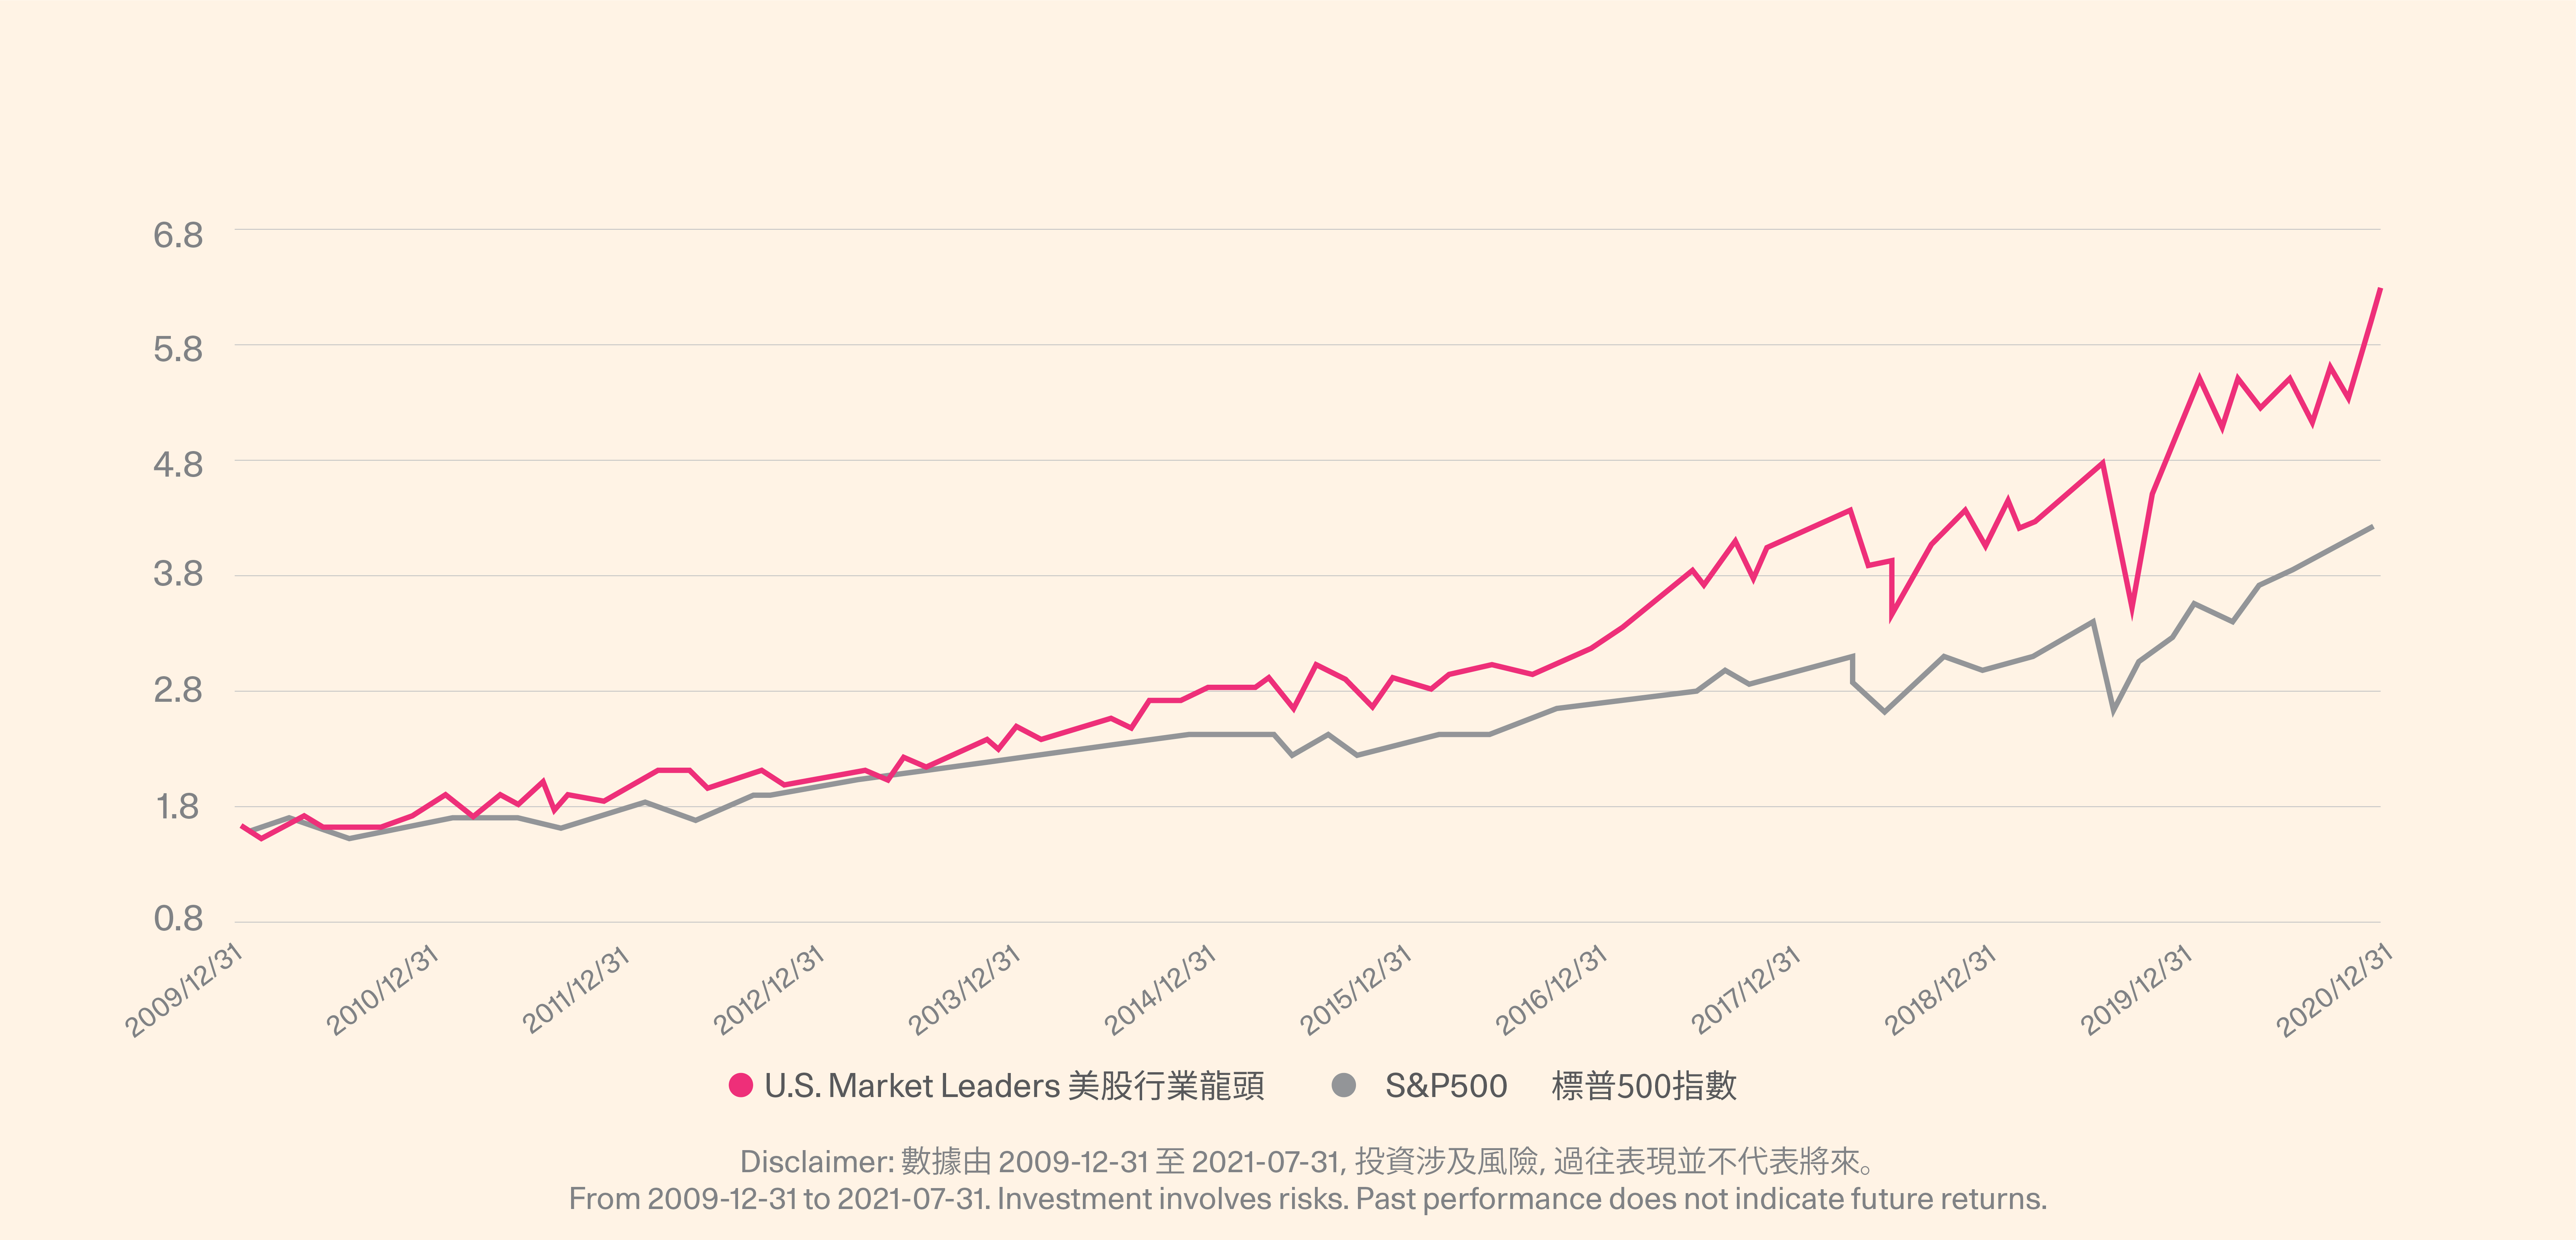
The portfolio has produced a higher return. US Market Leaders has a 90- day annualized yield of 72.66%, surpassing the benchmark S&P 500 index by about 50.48%. At the same time, the maximum drawdown of the portfolio is close to the benchmark, and the Sharpe ratio is 5.72, which is about 4.58 higher than the benchmark.
The portfolio has a 30-day annualized return of 101.40%, which exceeds the S&P 500 index by about 72.03%, and the Sharpe ratio is 10.46 at the 0.79% max. drawdown.
The above shows that our portfolio's short- and medium-term performance far exceeds the benchmark under the same risk level.
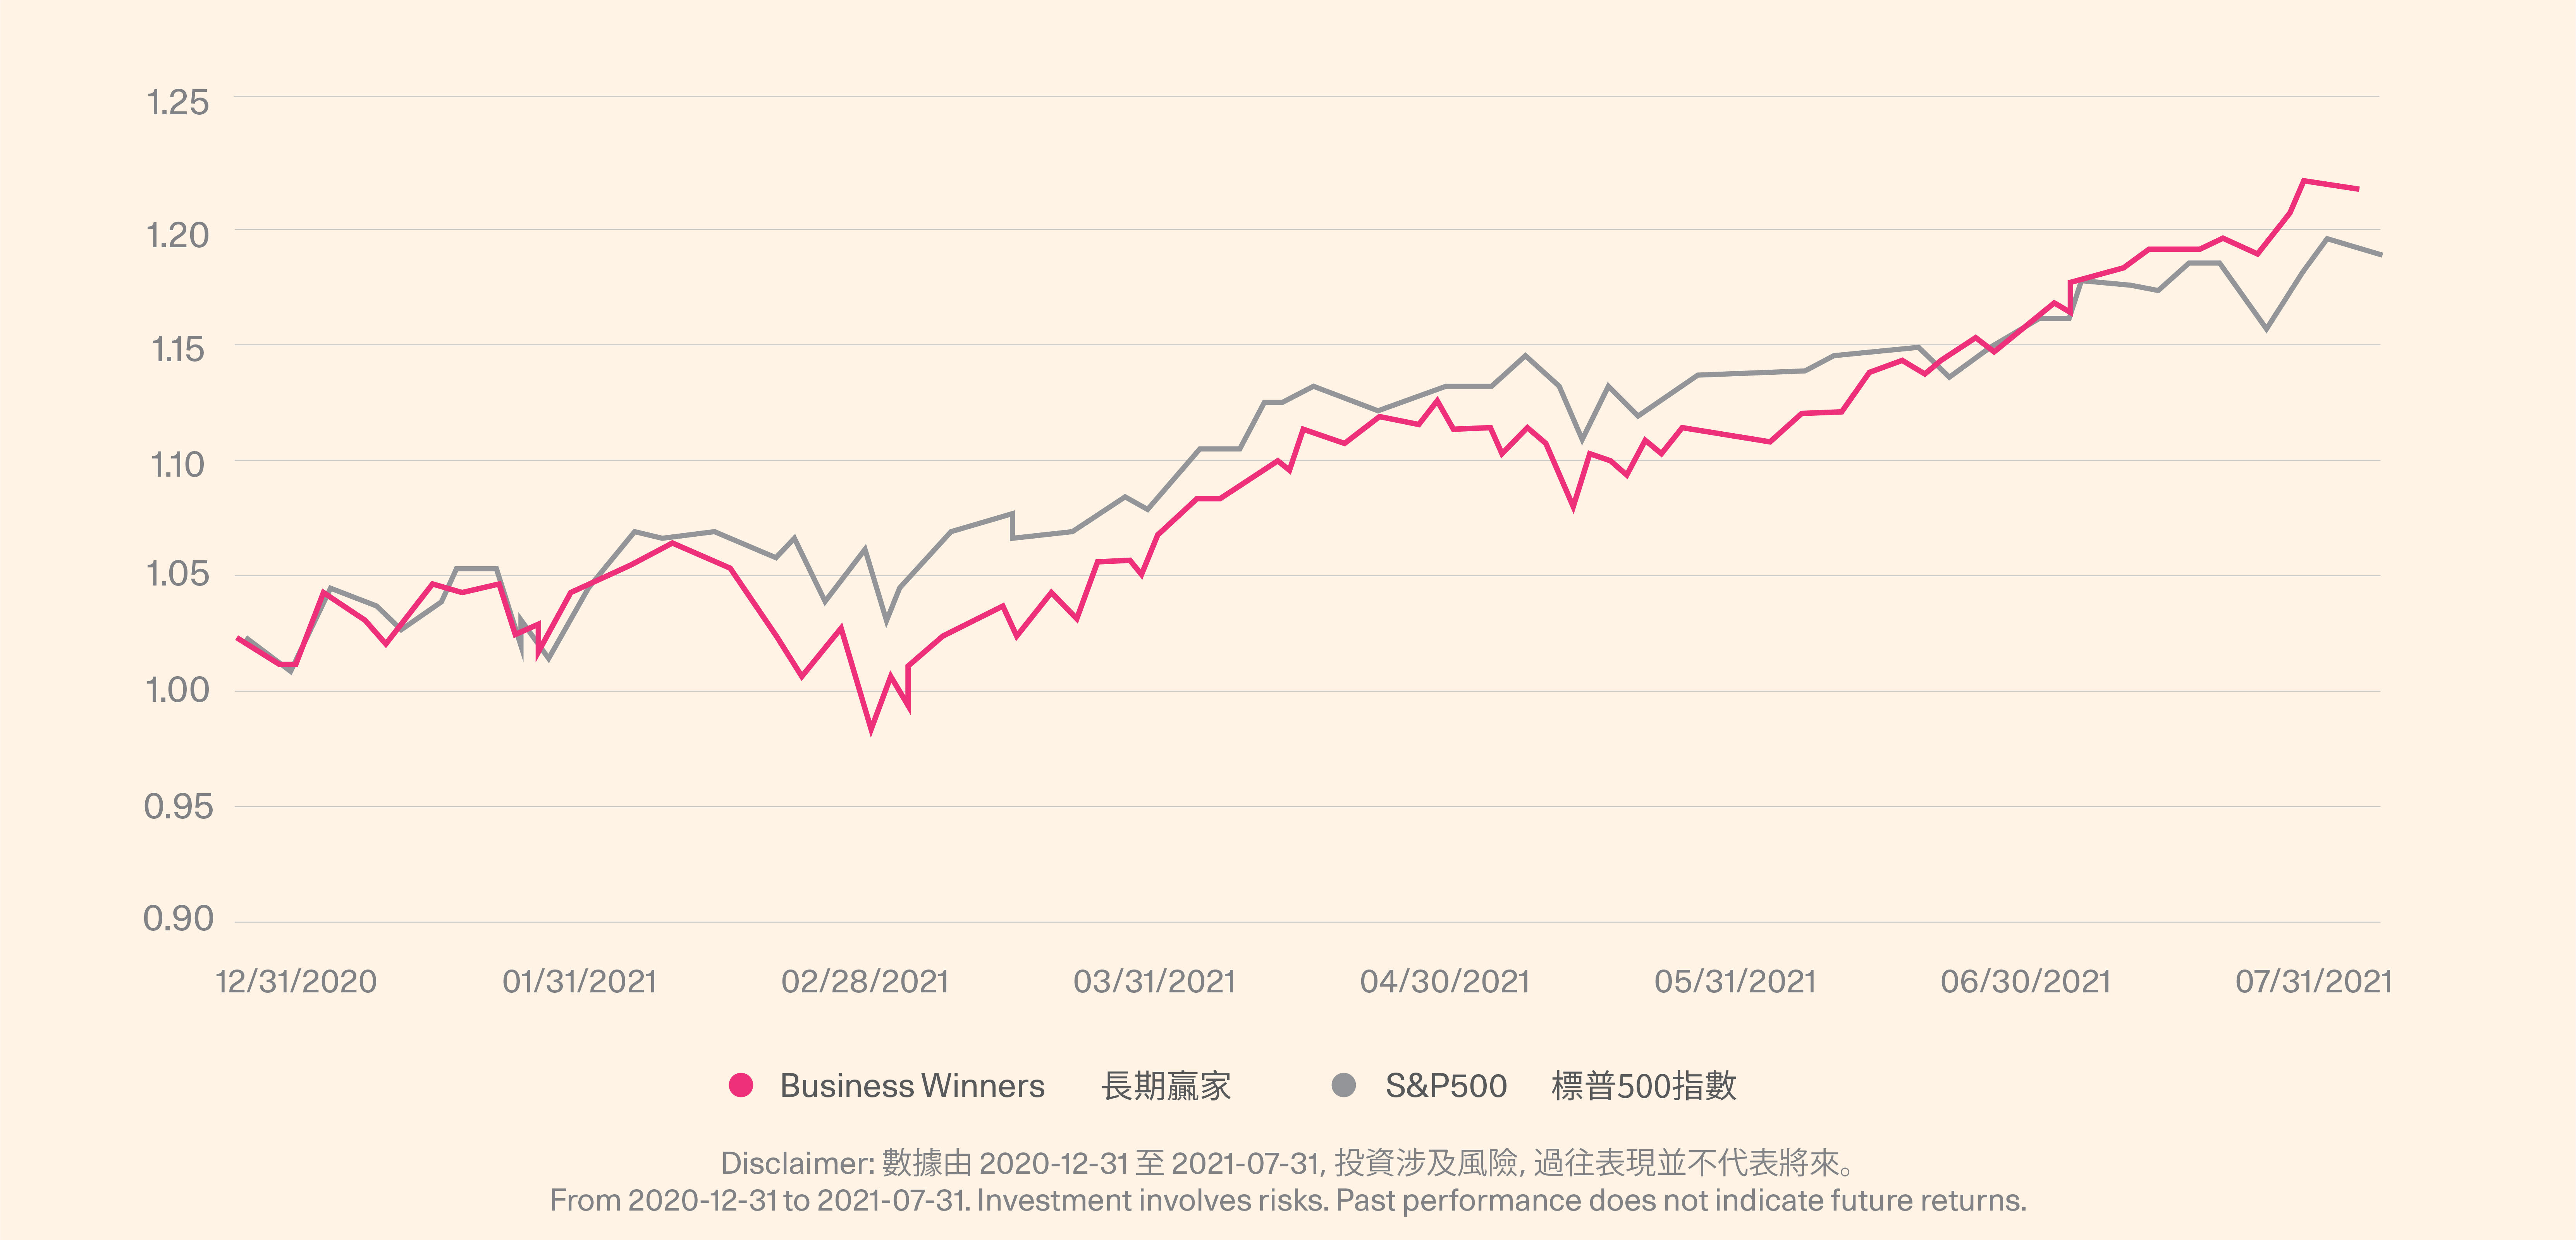
3. Backtested performance of Business Winners
YTD Performance
Whole Sample Period
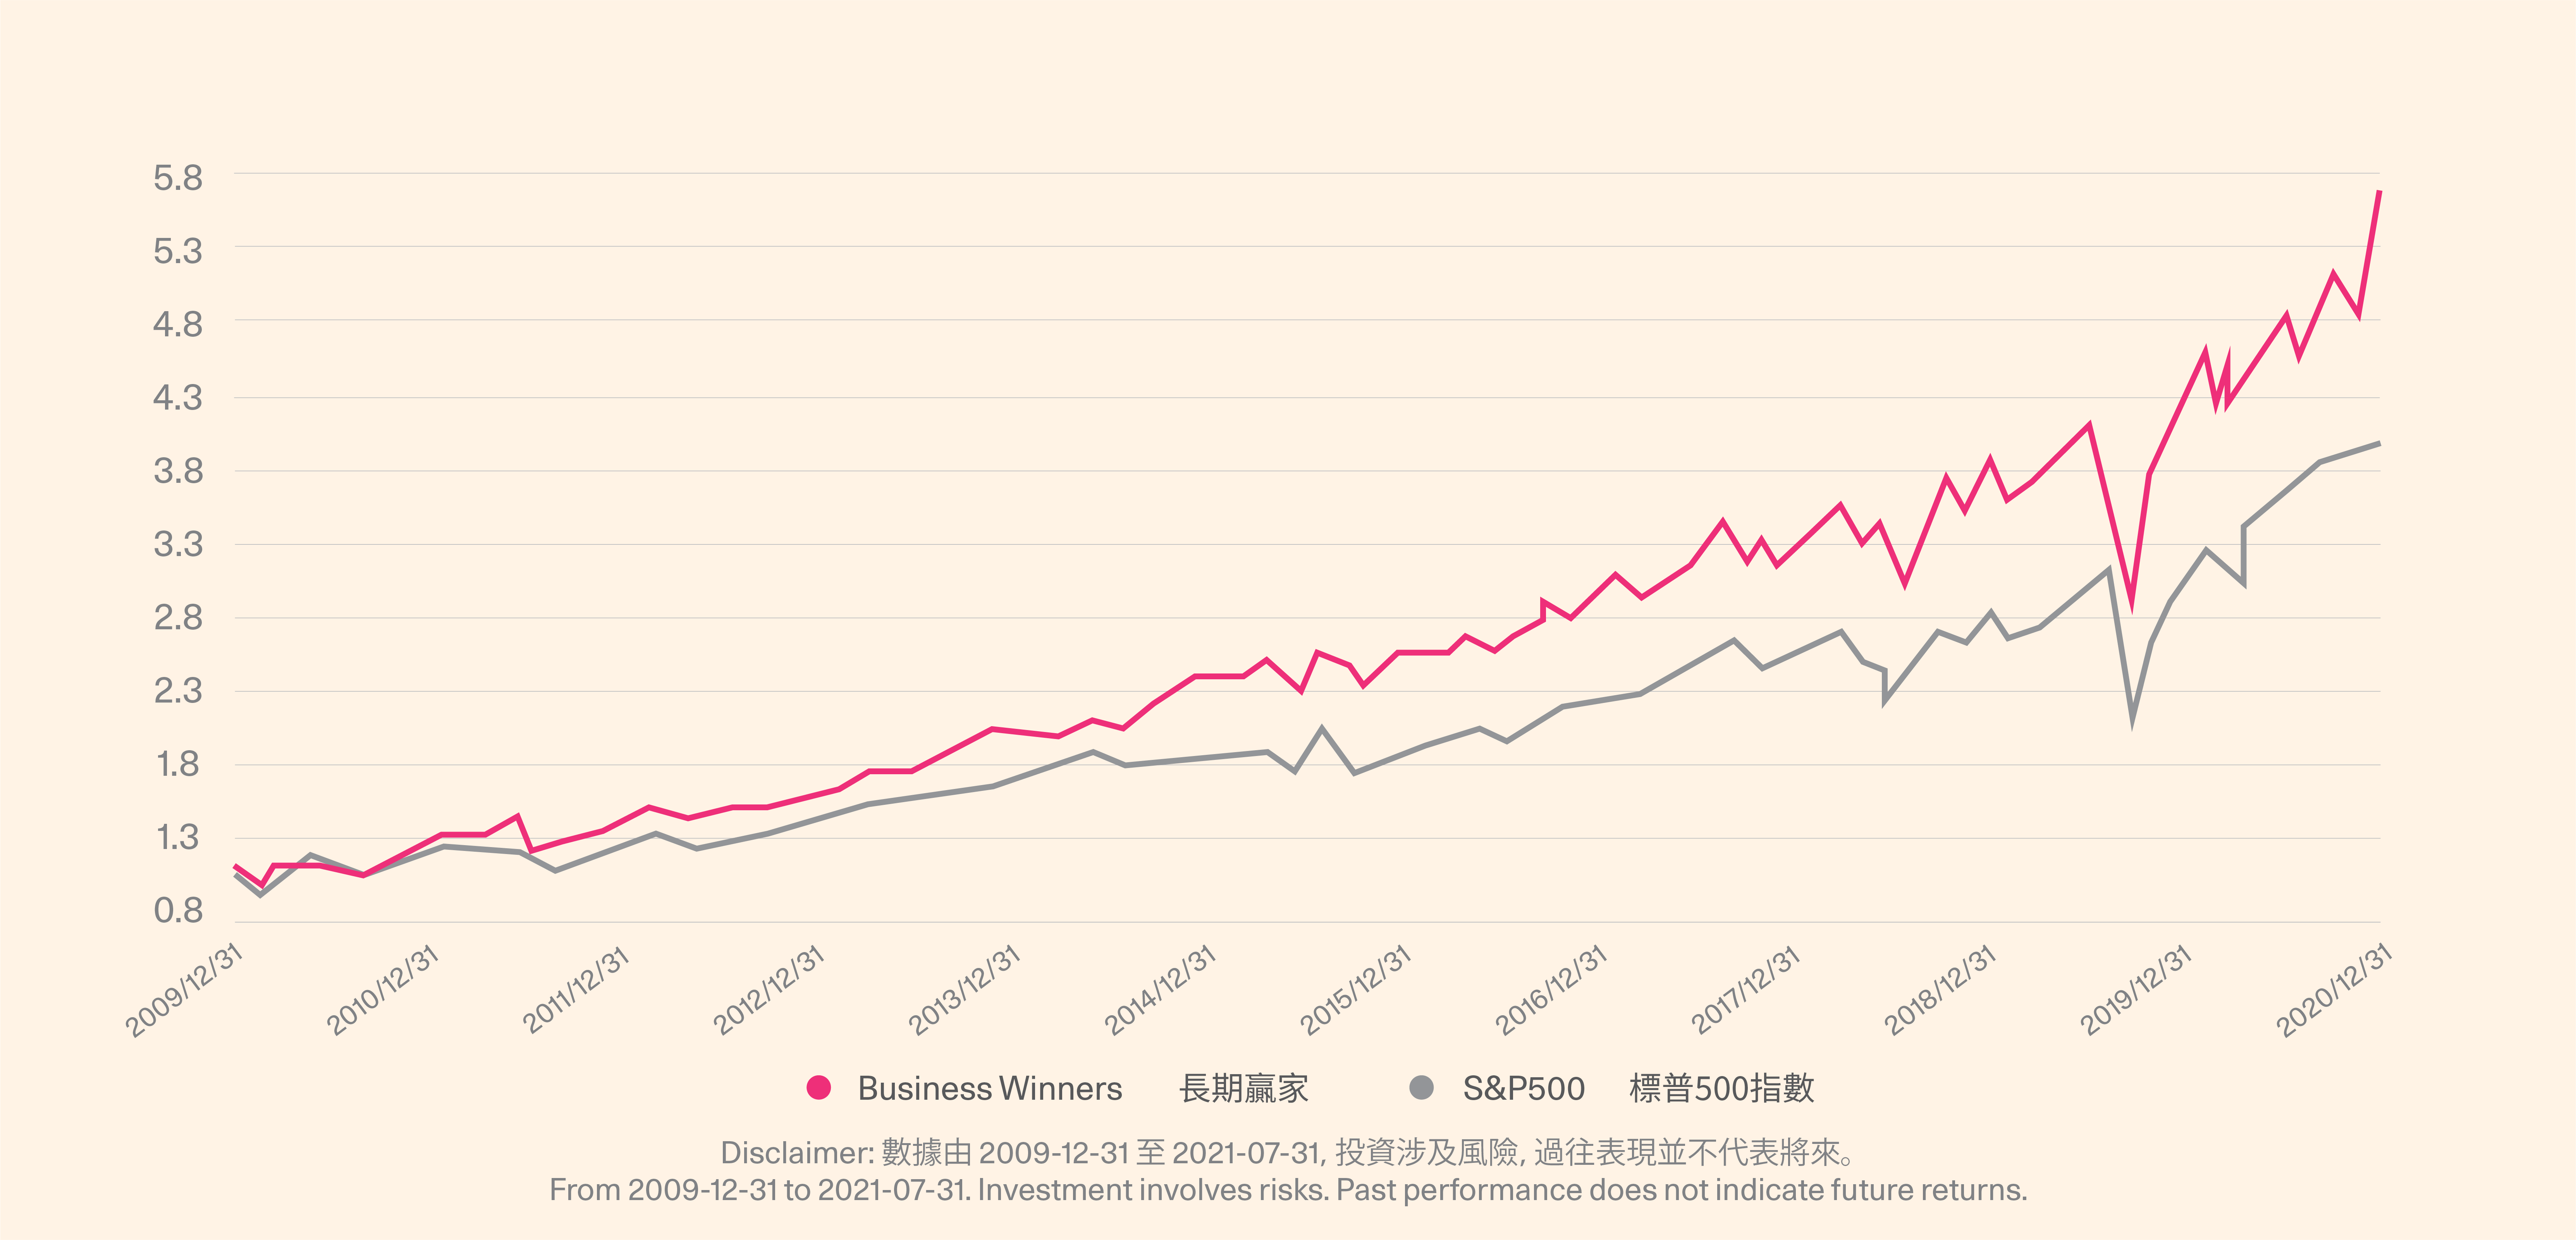
Business Winners has an annualized return of 18.25% over the past three years, which exceeds the S&P 500 index by 2.08%. The max drawdown remains the same as the benchmark. The Sharpe Ratio is 0.83, which is 0.13 higher than the benchmark.
The strategy has shown a relatively high rate of return. The portfolio has a 30-day annualized rate of return of 70.17%, surpassing the benchmark S&P 500 index by 37.80%. Meanwhile, the max. drawdown of the portfolio is -0.92%, which is lower than the benchmark, and the Sharpe ratio is 7.97, which is 5.15 higher than the benchmark.
4. Backtested performance of Profit Makers
YTD Performance
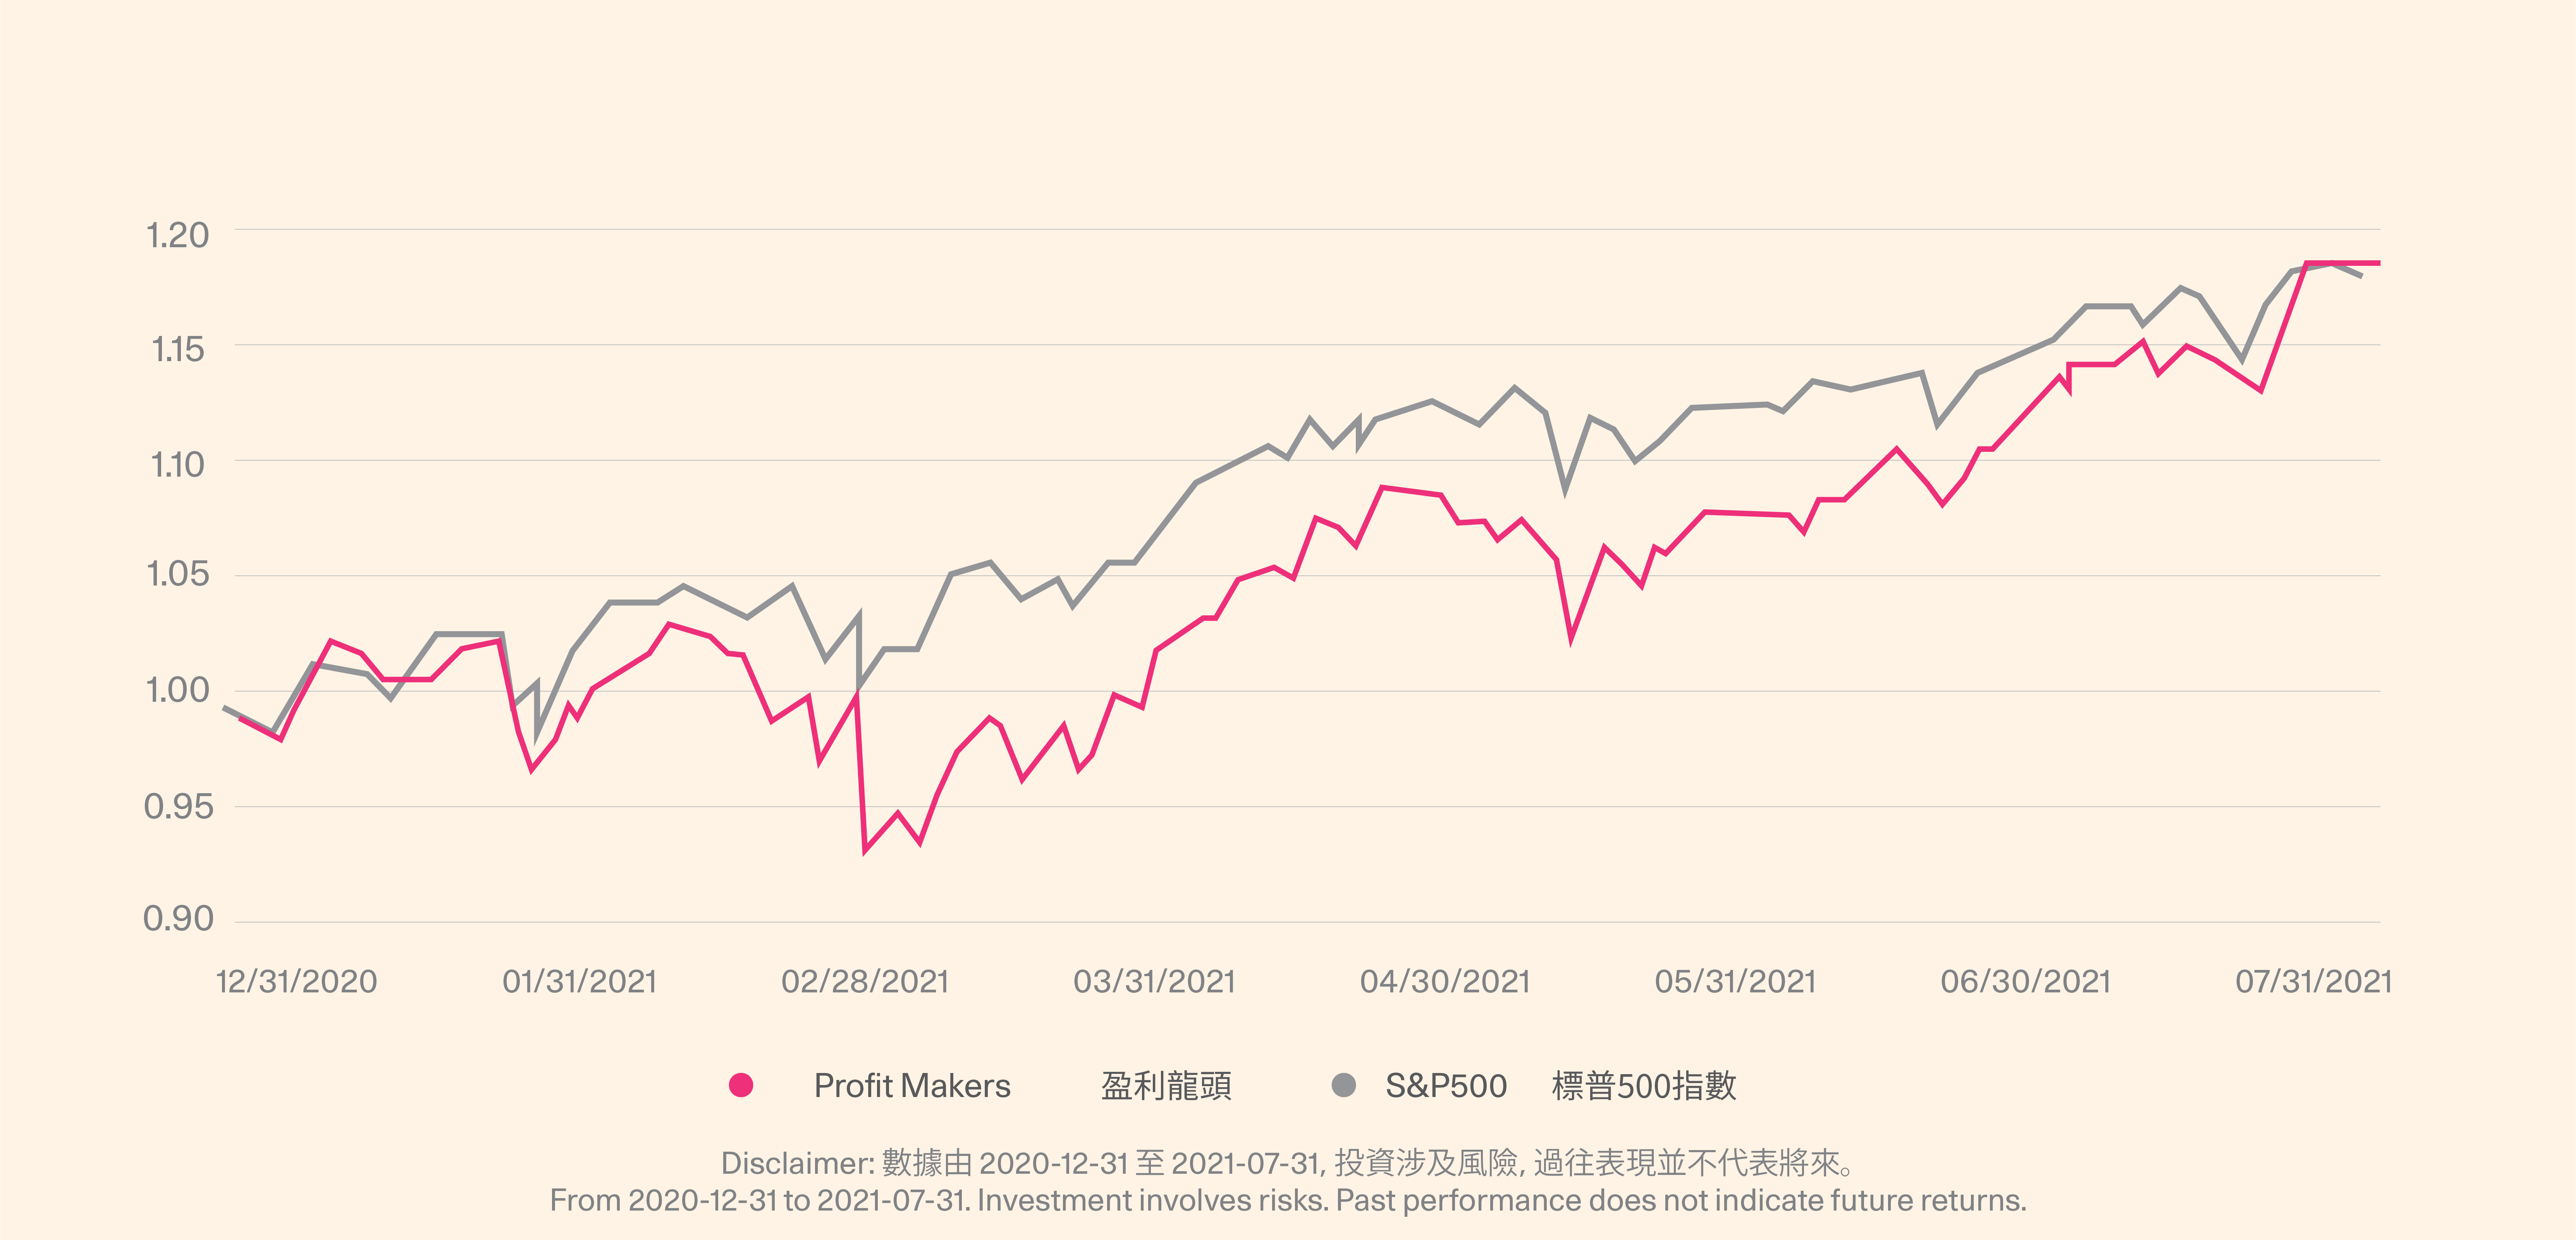
Whole Sample Period
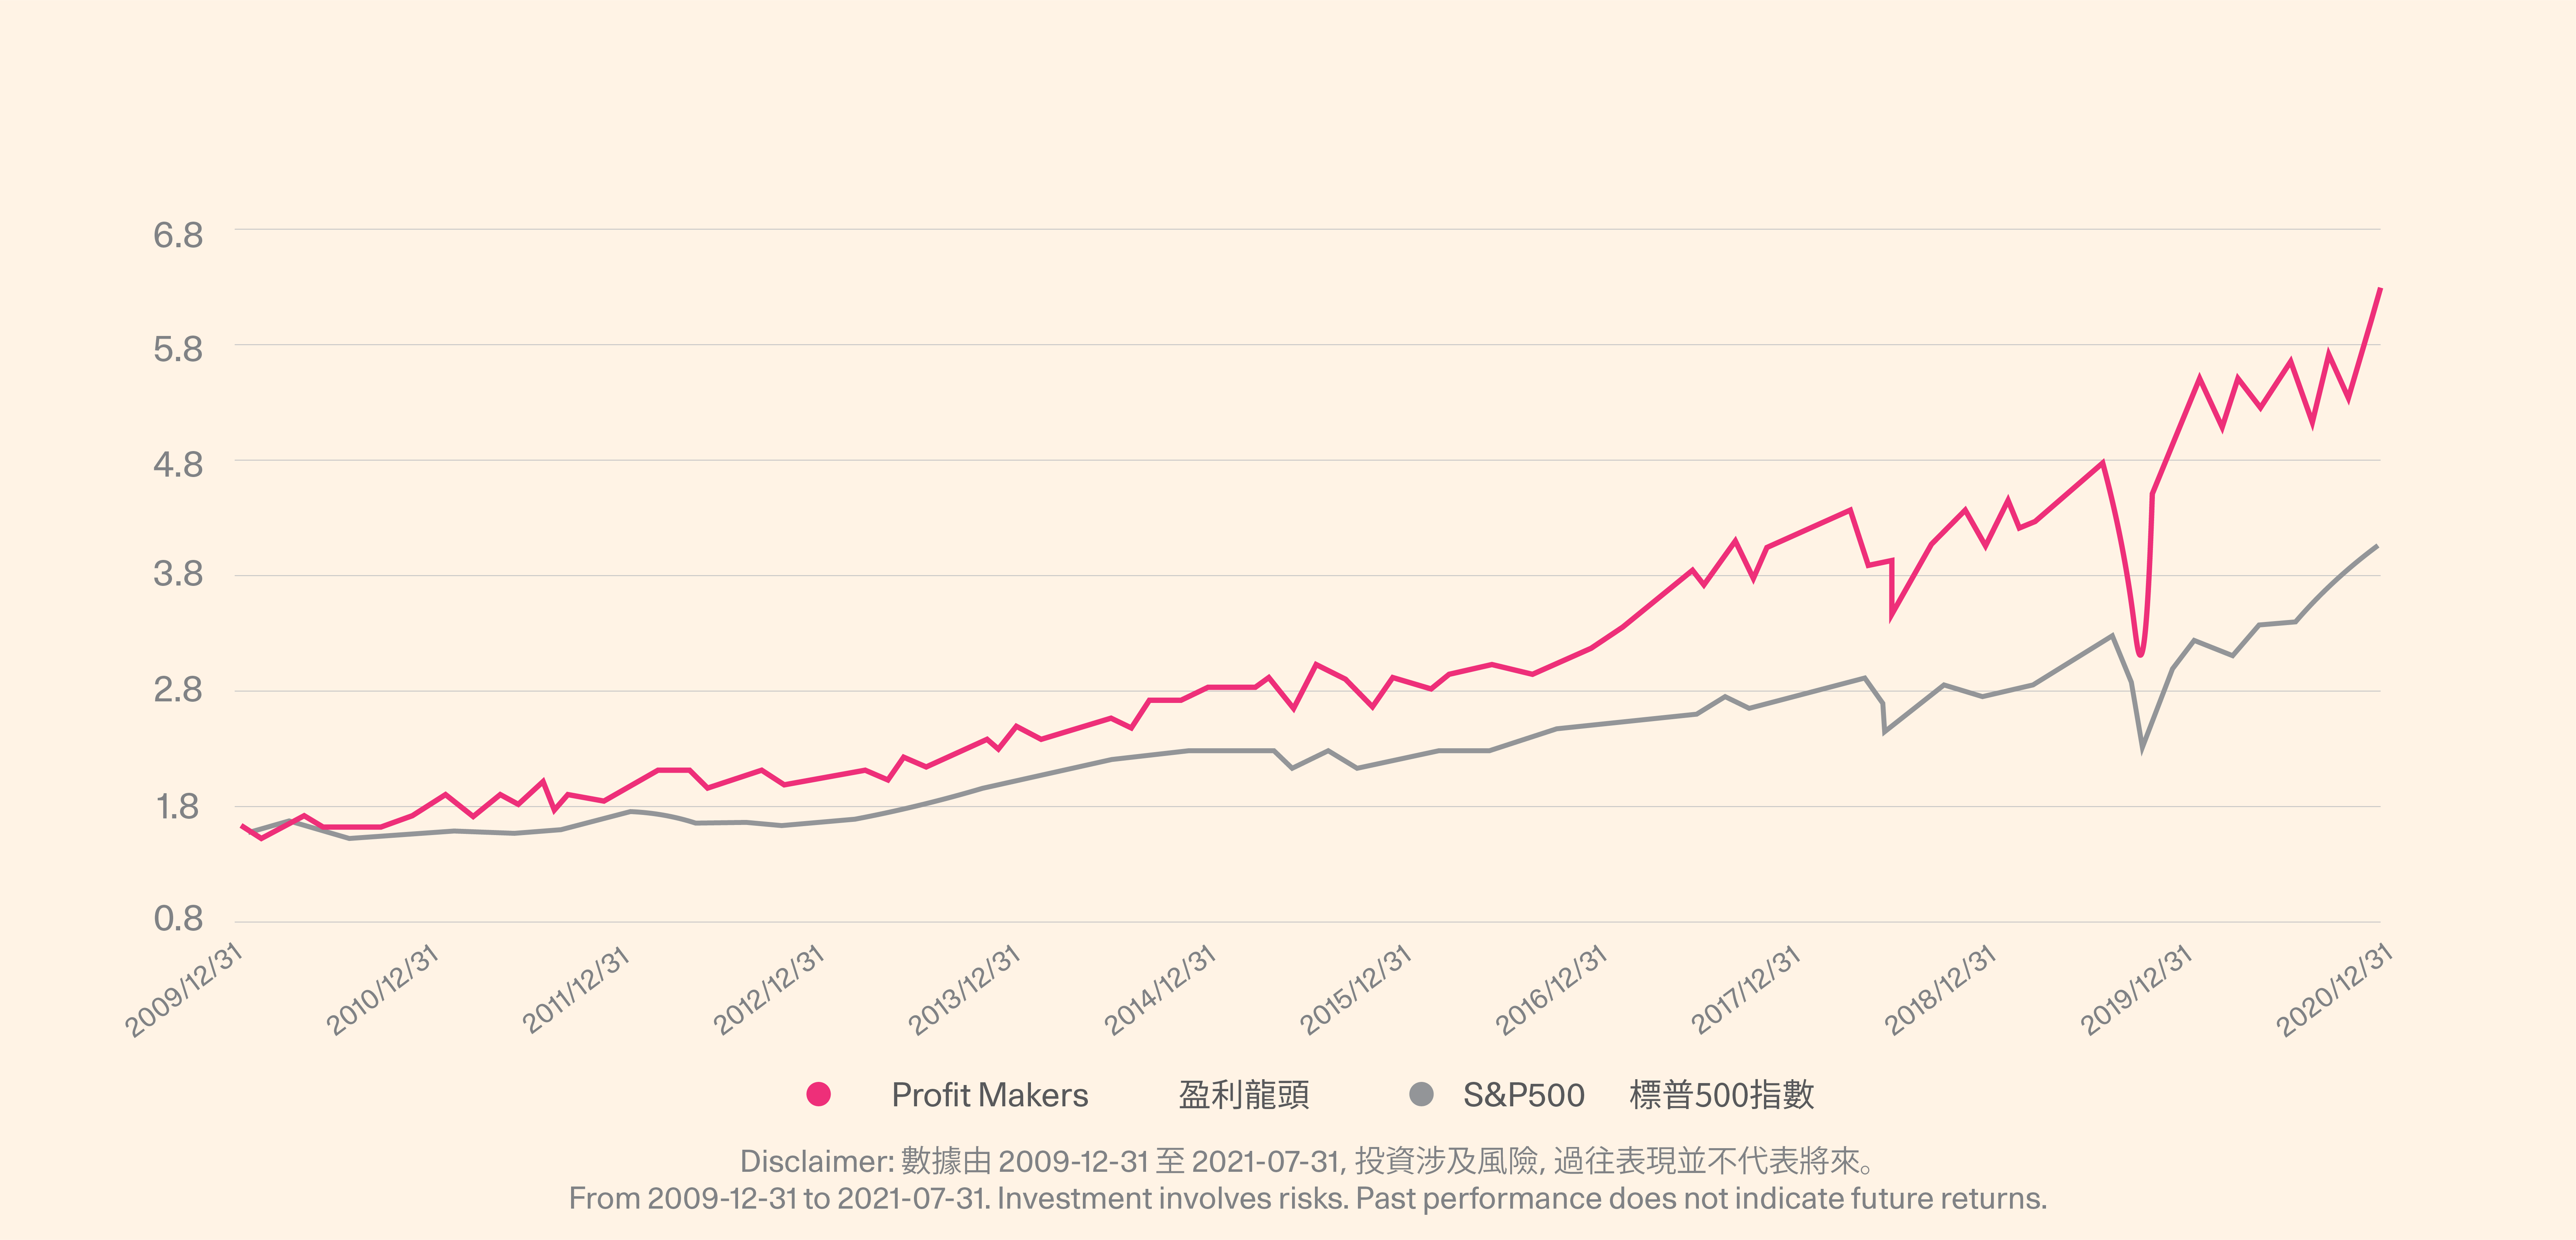
Profit Makers has a 30-day annualized return of 58.24%, exceeding the S&P 500 index by 25.87%. The max. drawdown is close to the benchmark. The Sharpe ratio is 5.39, which is higher than the benchmark of 2.57.
The portfolio has an annualized return rate of 18.90% in the past five years, surpassing the benchmark S&P 500 index by about 3.74%, and the Sharpe ratio is 0.97 when the portfolio's max. drawdown is 0.28 higher than the benchmark.
The portfolio overall has a better Sharpe ratio and performance than the benchmark.
5. Backtested performance of Health is Wealth
YTD Performance
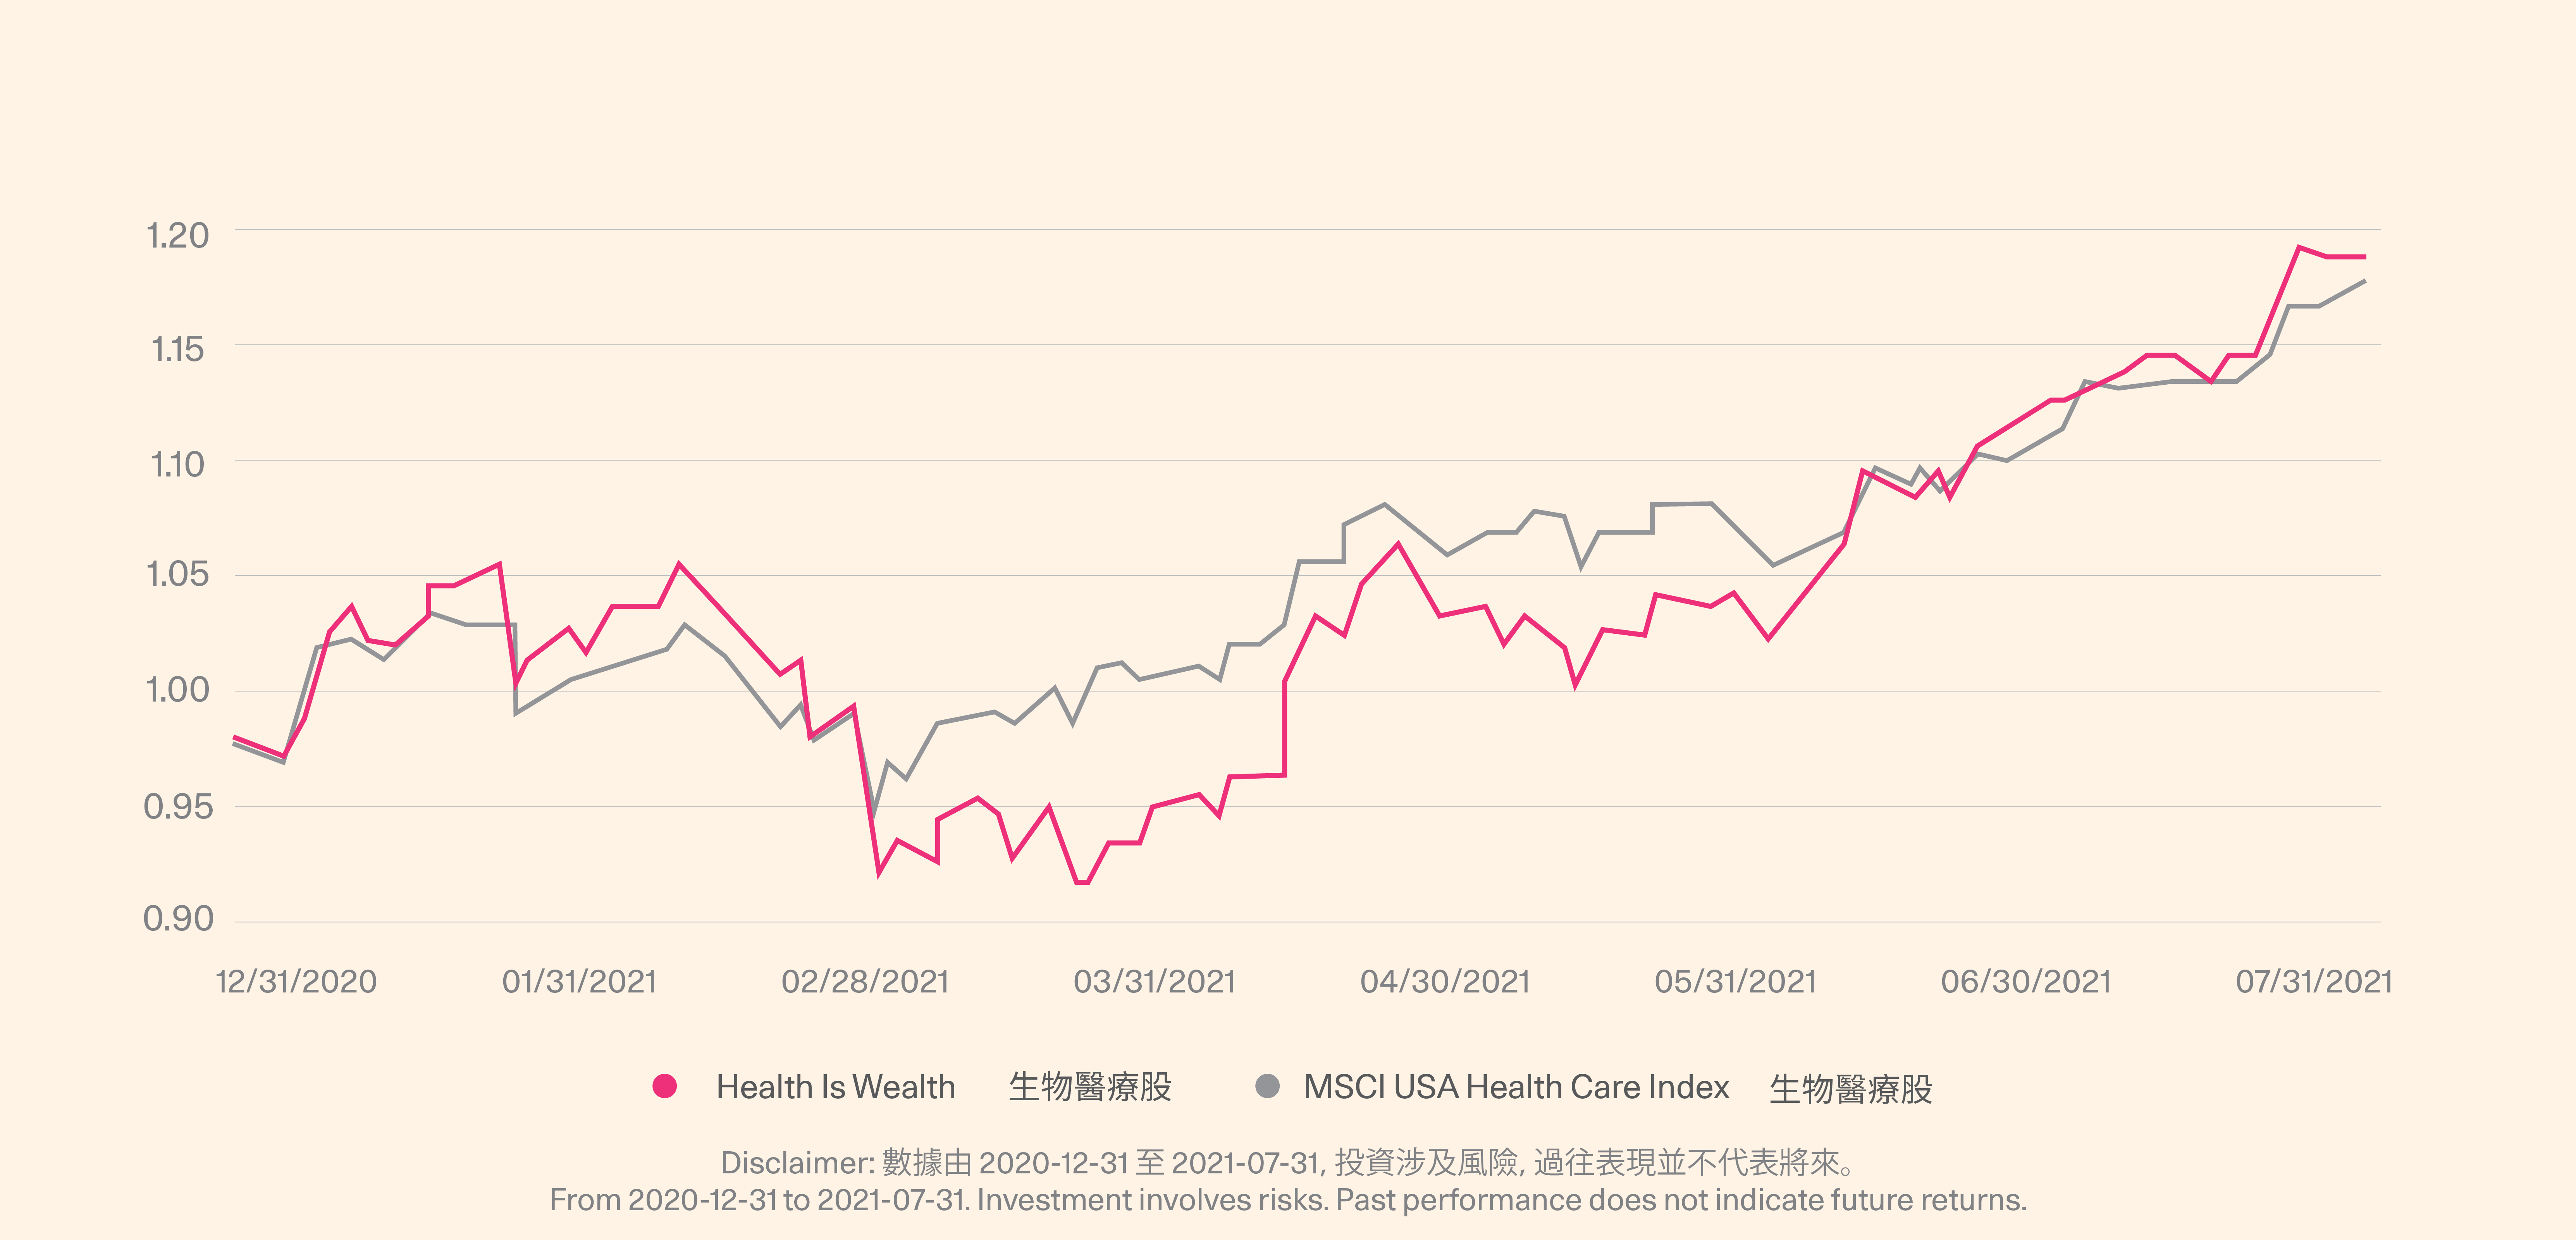
Whole Sample Period
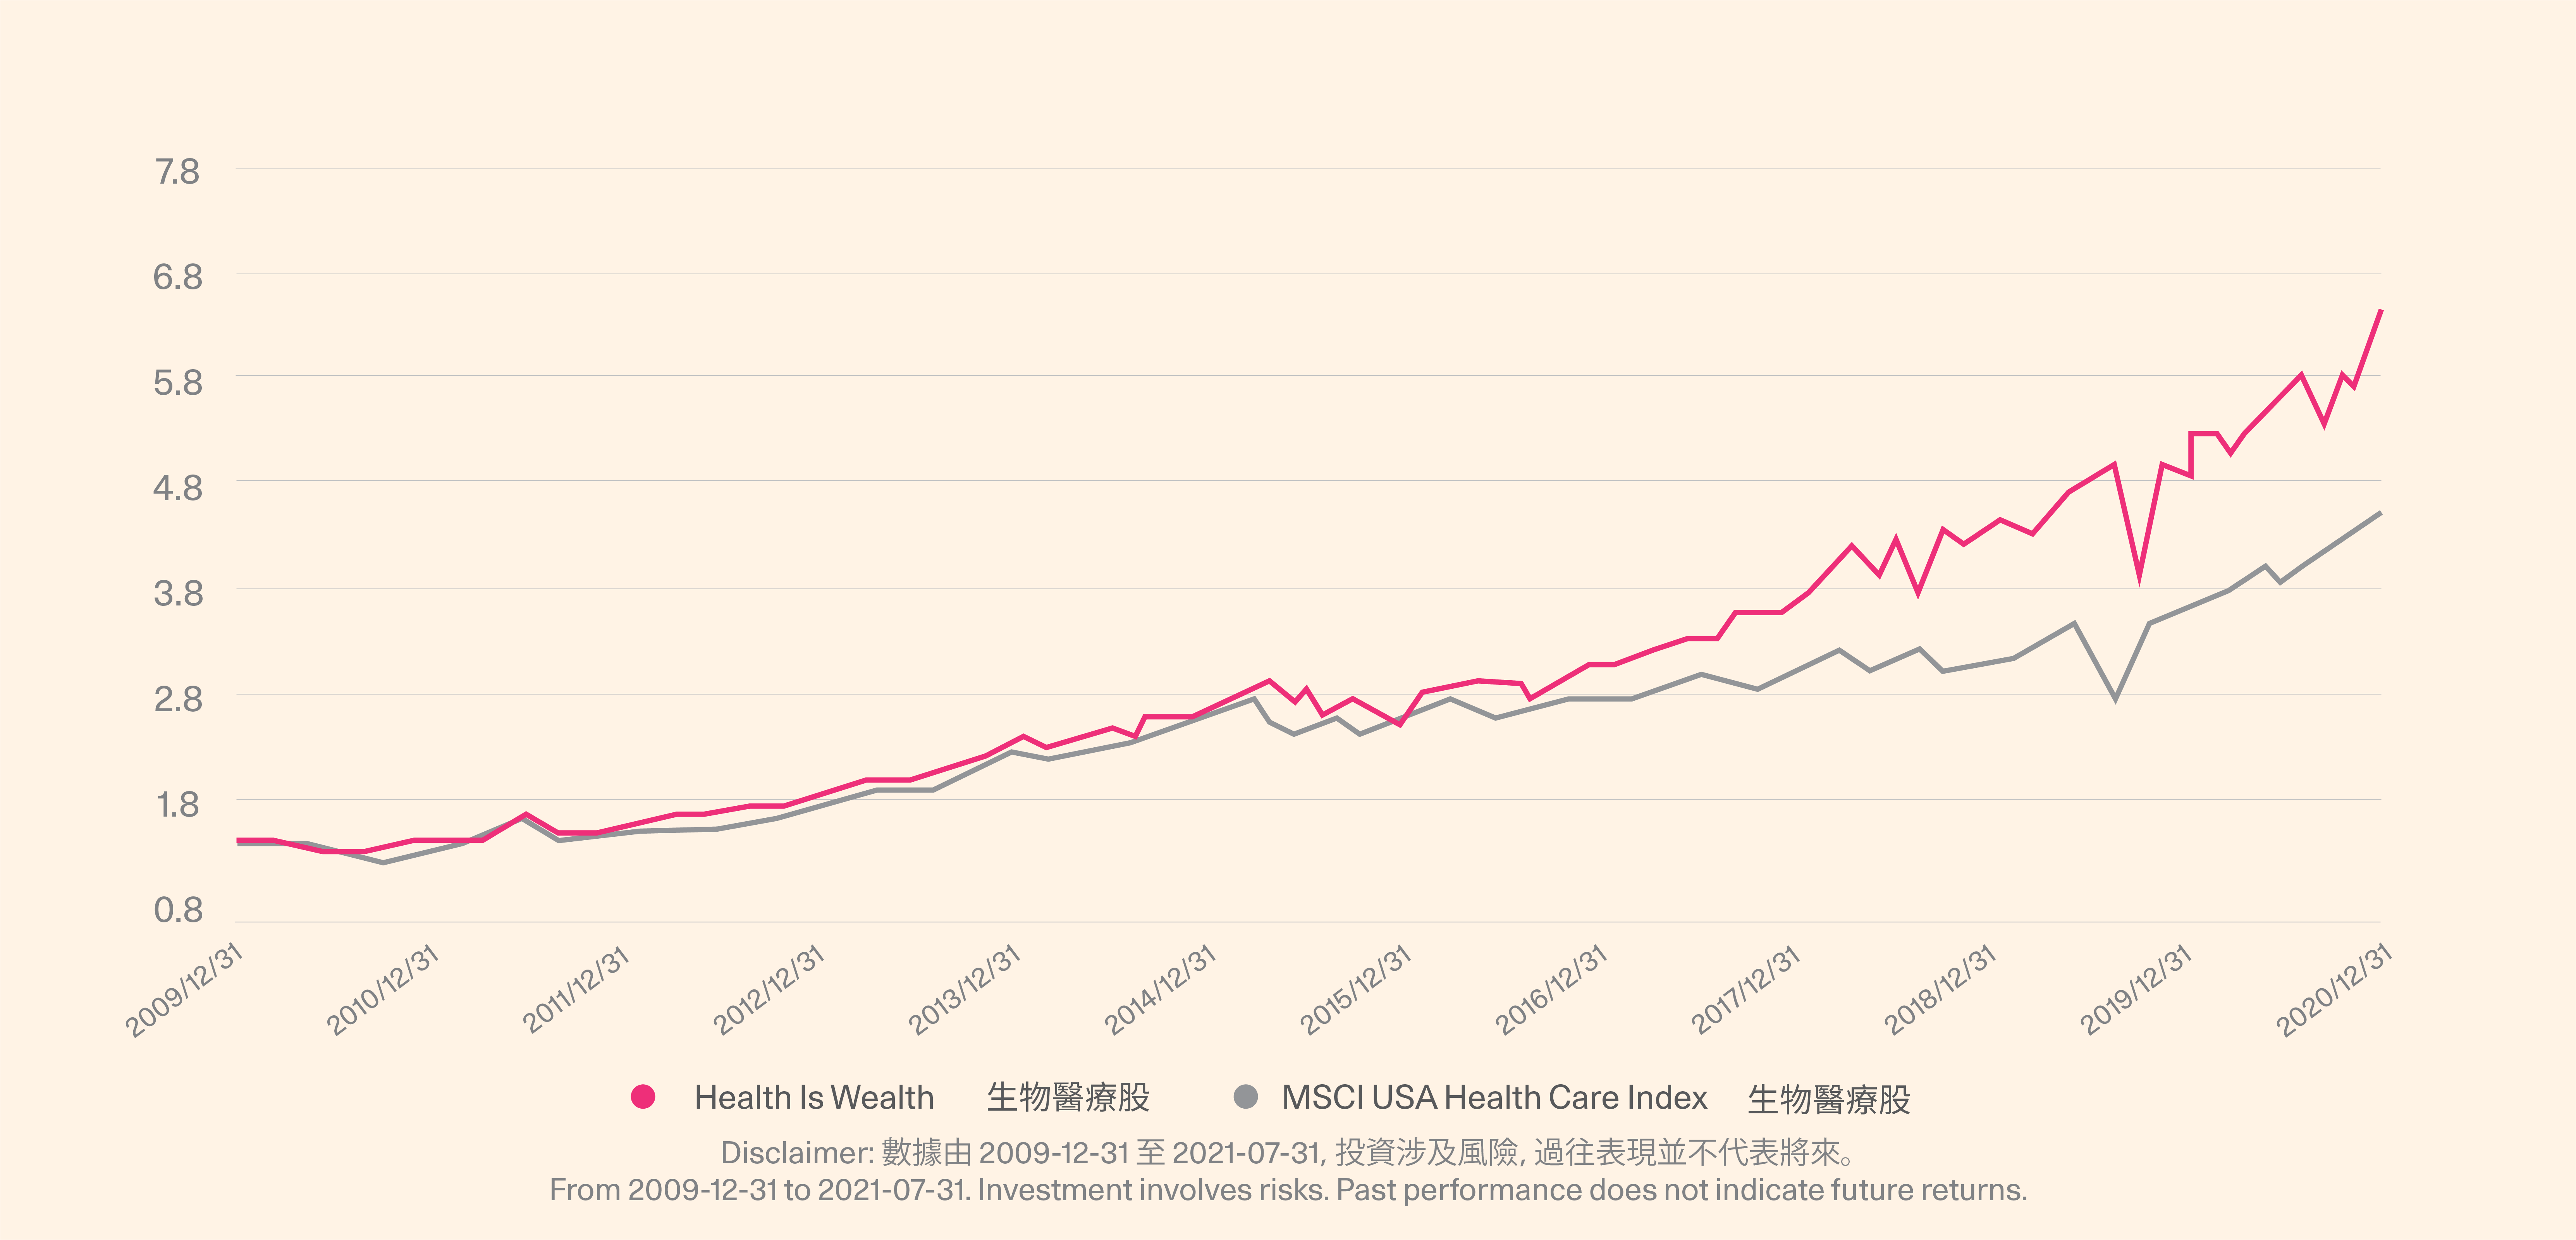
Health is Wealth has an annualized income of 61.94% in the past 90 days, which exceeds the MSCI U.S. Healthcare Index by 18.54%, and the Sharpe ratio is 1.04.
The portfolio had an annualized return rate of 18.29% in the past five years, surpassing the benchmark MSCI US Healthcare Index by 5.85%. The max. drawdown is lower than the benchmark, and the Sharpe ratio is 0.97, about 0.28 higher than the benchmark.
Health is Wealth could achieve a better performance than the benchmark in both the short-term and the long-term after the rebalancing.
About us
AQUMON is a Hong Kong based award-winning financial technology company. Our mission is to leverage smart technology to make next-generation investment services affordable, transparent and accessible to both institutional clients and the general public. Through its proprietary algorithms and scalable, technical infrastructure, AQUMON’s automated platform empowers anyone to invest and maximise their returns. AQUMON has partnered with more than 100 financial institutions in Hong Kong and beyond, including AIA, CMB Wing Lung Bank, ChinaAMC, and Guangzhou Rural Commercial Bank. Hong Kong University of Science and Technology, the Alibaba Entrepreneurs Fund, affiliate of BOC International Holdings Limited, Zheng He Capital Management and Cyberport are among AQUMON's investors.
The brand is held under Magnum Research Limited and is licensed with Type 1, 4 and 9 under the Securities and Futures Commission (SFC) of Hong Kong. AQUMON is also licensed by the U.S. Securities and Exchange Commission (SEC) and the Asset Management Association of China (AMAC).
Disclaimer
Viewers should note that the views and opinions expressed in this material do not necessarily represent those of Magnum Research Group and its founders and employees. Magnum Research Group does not provide any representation or warranty, whether express or implied in the material, in relation to the accuracy, completeness or reliability of the information contained herein nor is it intended to be a complete statement or summary of the financial markets or developments referred to in this material. This material is presented solely for informational and educational purposes and has not been prepared with regard to the specific investment objectives, financial situation or particular needs of any specific recipient. Viewers should not construe the contents of this material as legal, tax, accounting, regulatory or other specialist of technical advice or services or investment advice or a personal recommendation. It should not be regarded by viewers as a substitute for the exercise of their own judgement. Viewers should always seek expert advice to aid decision on whether or not to use the product presented in the marketing material. This material does not constitute a solicitation, offer, or invitation to any person to invest in the intellectual property products of Magnum Research Group, nor does it constitute a solicitation, offer, or invitation to any person who resides in the jurisdiction where the local securities law prohibits such offer. Investment involves risk. The value of investments and its returns may go up and down and cannot be guaranteed. Investors may not be able to recover the original investment amount. Changes in exchange rates may also result in an increase or decrease in the value of investments. Any investment performance information presented is for demonstration purposes only and is no indication of future returns. Any opinions expressed in this material may differ or be contrary to opinions expressed by other business areas or groups of Magnum Research Limited and has not been updated. Neither Magnum Research Limited nor any of its founders, directors, officers, employees or agents accepts any liability for any loss or damage arising out of the use of all or any part of this material or reliance upon any information contained herein.