

SmartGlobal® (US ETF) 2018 Annual Investment Return Report
Written by AQUMON Team on 2019-01-15
Due to a series of events, such as U.S.-China trade war, the Fed’s interest rate hike and the French 'yellow vest' protests, the global stock market has suffered losses in 2018. All sectors in the market have recorded considerable losses.
On March 22, based on USTR’s Section 301 report, President Donald Trump signed a memorandum, instructing to impose tariffs on $60 billion of Chinese imports and restrict Chinese enterprises investing in U.S. mergers and acquisitions. In response, the Chinese Ministry of Commerce carried out tariffs measures, which announced the official start of the trade war. Since then, frequent disputes between the two sides affected global market sentiment negatively. At the G20 summit in December 2018, President Xi Jinping and President Donald Trump reached an agreement on holding a 90-day negotiation, and suspended new trade measures during the negotiation period.
As an indicator of the global economic market, the trend of the Fed’s rate attracts huge public attention. Although there were only 155,000 new jobs created in November 2018, the Fed was still optimistic about the U.S. economy. In the last meeting in 2018, the Fed decided to raise the interest rate to 2.25%-2.5%, which was the fourth rate hike in 2018, and the ninth since the Fed started the cycle three years ago.
The European market also struggled in 2018. Many economic systems in the European Union suffered troubles: in France, the 'yellow vest' protested against President Markron on the reform of agenda; Germany faces a political transformation that Chancellor Merkel was forced to step down from the party chairman and will retire at the end of this term; the Italian populist government and the European Commission have been arguing over the 2019 budget draft; the Polish government has accepted the so-called “non-liberal democracy” and is pursuing policies that inconsistent with E.U. values; the Spanish government is still at a weak position; in the UK, the internal differences of the Conservative Party have hindered the Brexit progress and also hindered policies that can promote growth and productivity.
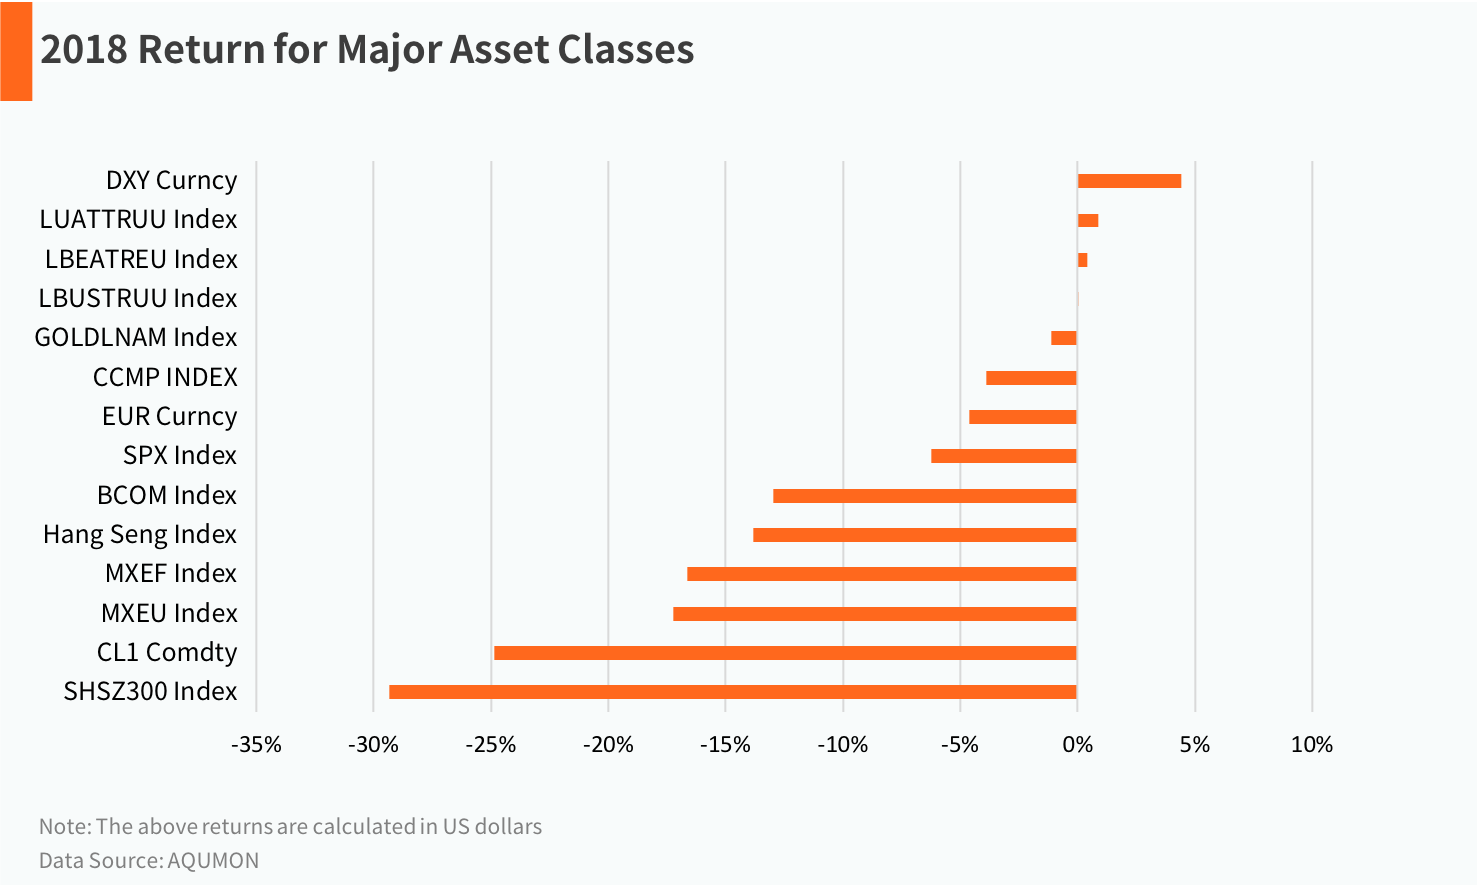
Nearly all major financial assets recorded negative returns in 2018. CSI 300 Index and MSCI European Market Index have dropped nearly 30% and over 15%, respectively. In the U.S. market, a 6% plunge in S&P 500 have already catapulted the market into a bear one.
Strategy Performance
AQUMON SmartGlobal® (US ETF) provides global asset allocation services for investors by investing in United States-listed exchange-traded funds (ETF). This helps investors achieve long-term growth in their assets by riding on the sustainability of global economic growth.
To come up with long-term global asset allocation portfolios, AQUMON SmartGlobal® (US ETF) considers factors such as assets under management, listing date, transaction fees, tracking error and liquidity to select the best ETFs from a pool of over 2,000 in the US market. The pool of ETFs covers different sectors in more than 50 countries.
Performance Analysis
1. In the portfolios, SCHF (developed markets except US), VTI (US), and ASHR (China) declined the most. These three segments represent the most important countries and regions in the global stock market.
2. But the good news is that the strategy performed well in specific regions and industry selection. For example, both INDA (India) and QQQ (Nasdaq) outperformed the market.
3. In the bond market, the strategy allocates to FLOT (floating debt) and SHV (short-term debt), which effectively overcomes the negative impact of the US interest rate hike, generating positive returns to the portfolio.
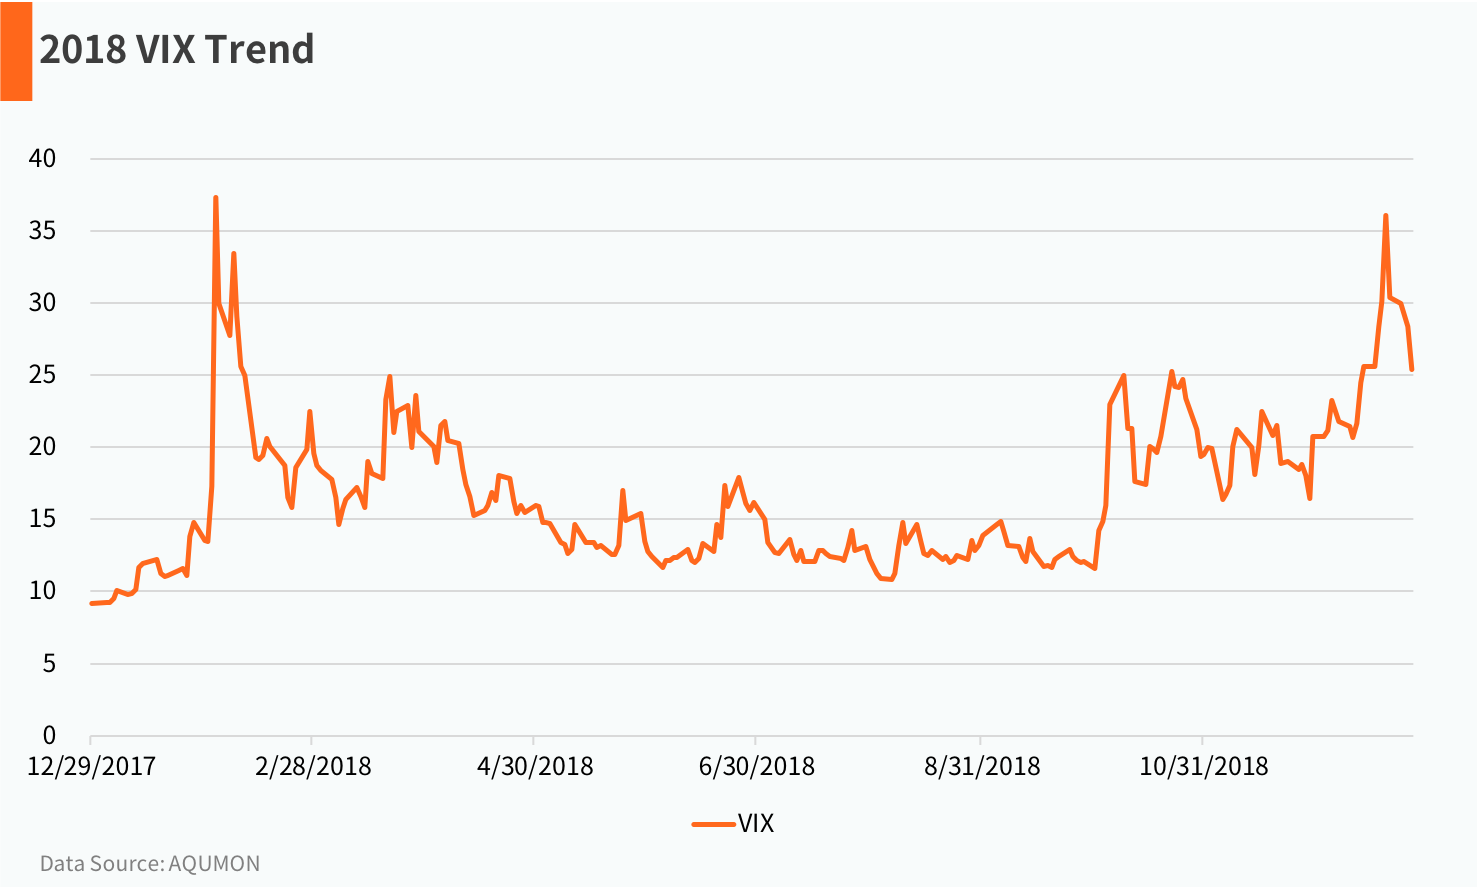
In fact, high volatility of the market this year can be explained from investors' concerns about trade war. Since President Trump announced to impose tariffs on imported steel and aluminium products in March, trade friction between China and the United States has intensified. And President Trump’s trade protectionism has caused panic in global stock markets, making the panic index (VIX) hit 37.32%. Although the VIX index fell after the negotiation, it again climbed to a high point in December after the United States asked for the arrest of the CFO of Huawei.
Going into 2019, the market is still full of uncertainties. High volatility is becoming a commonplace. In the coming months, the market is likely to continue be affected by the trade war, the Iran situation, America’s upcoming election, political stability factors in European countries e.t.c.
In order to cope with increasing market volatility, investors have to maintain a diversified portfolio to acquire long-term growth while minimizing risk.
As a trusted robo-advisor, AQUMON will continue to monitor global financial markets and client’s portfolio, and provide round-the-clock wealth management services to make investing as effortless as possible for our clients.
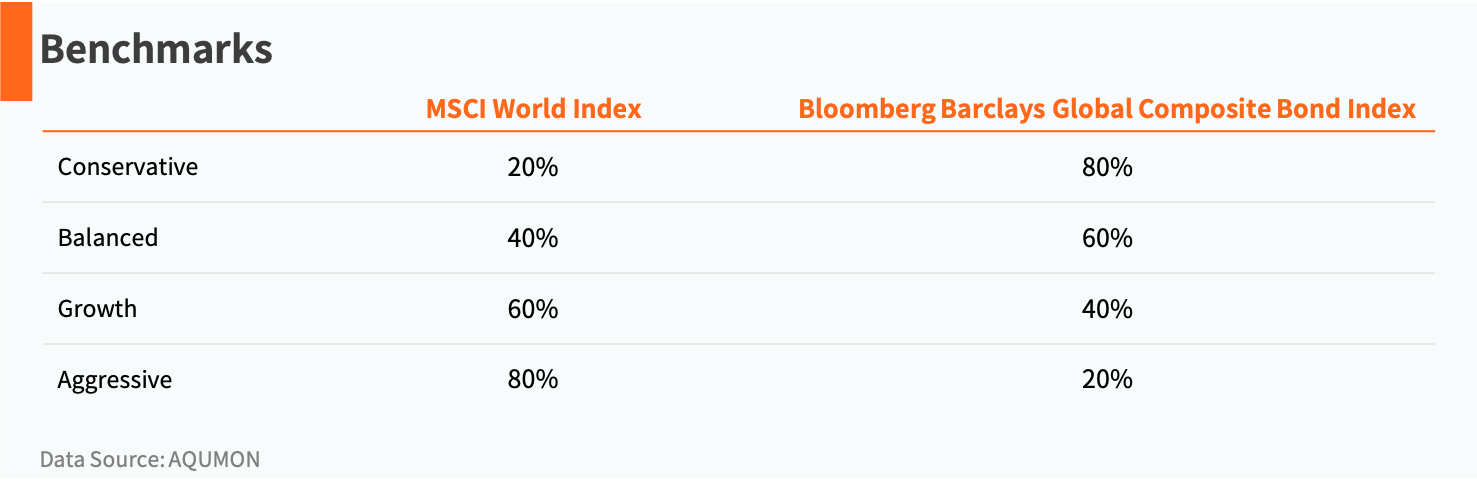
Benchmark
The benchmarks consist of the following indices with a corresponding ratio. For fair comparison, the volatility of the benchmarks selected by Magnum Research is similar to the corresponding investment portfolios.
ARC Private Client Indices (ARC PCI)
ARC PCI is a set of risk-based indices designed to be used by private clients and their advisers in assessing the performance of any discretionary portfolio with a non-specialist mandate. There are four PCI series for each currency, designed specifically for investors with Sterling, US Dollar, Euro or Swiss Franc as their reference currency. All PCI in this article are calculated in US dollars.
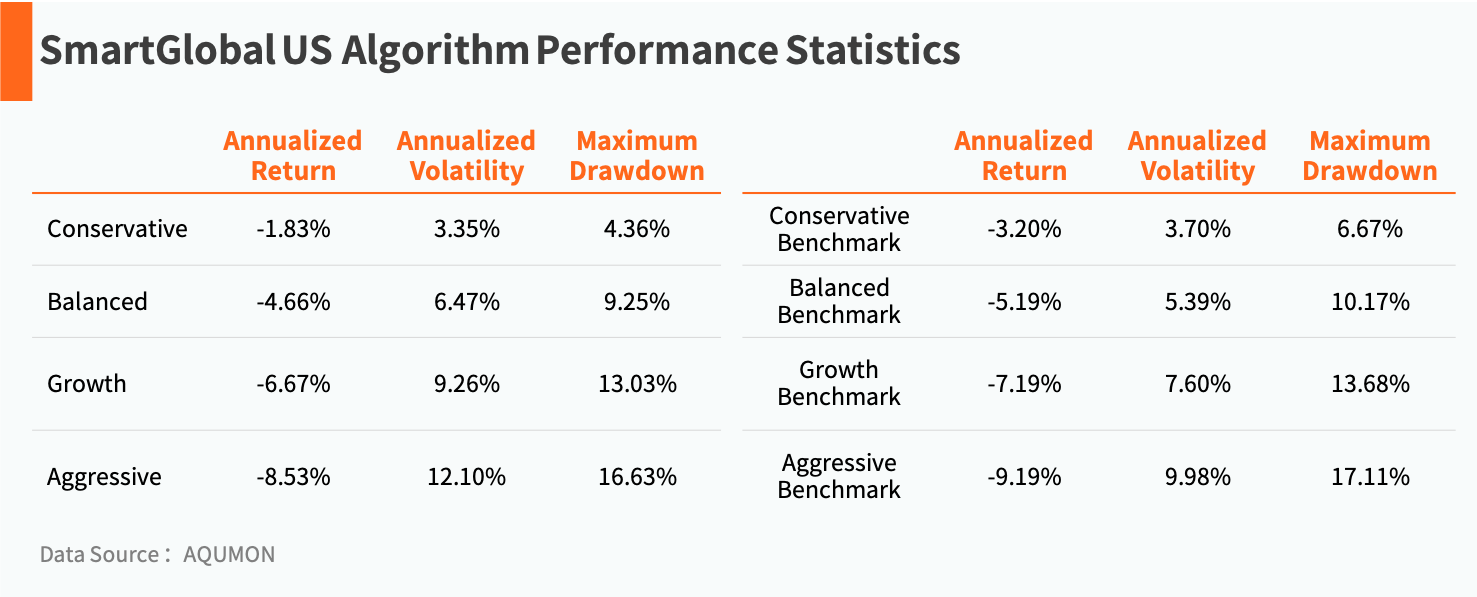
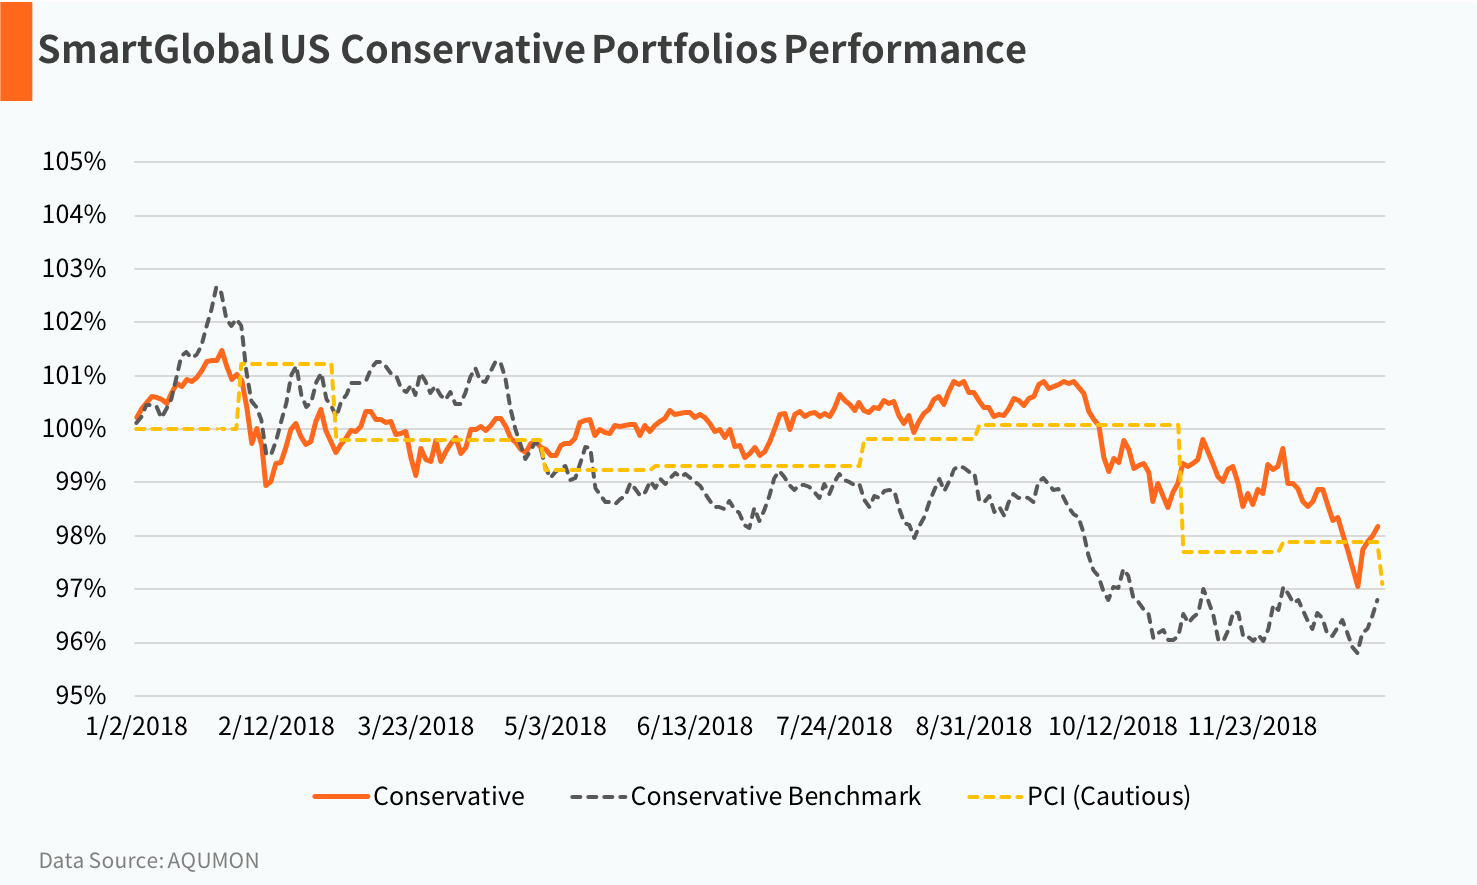
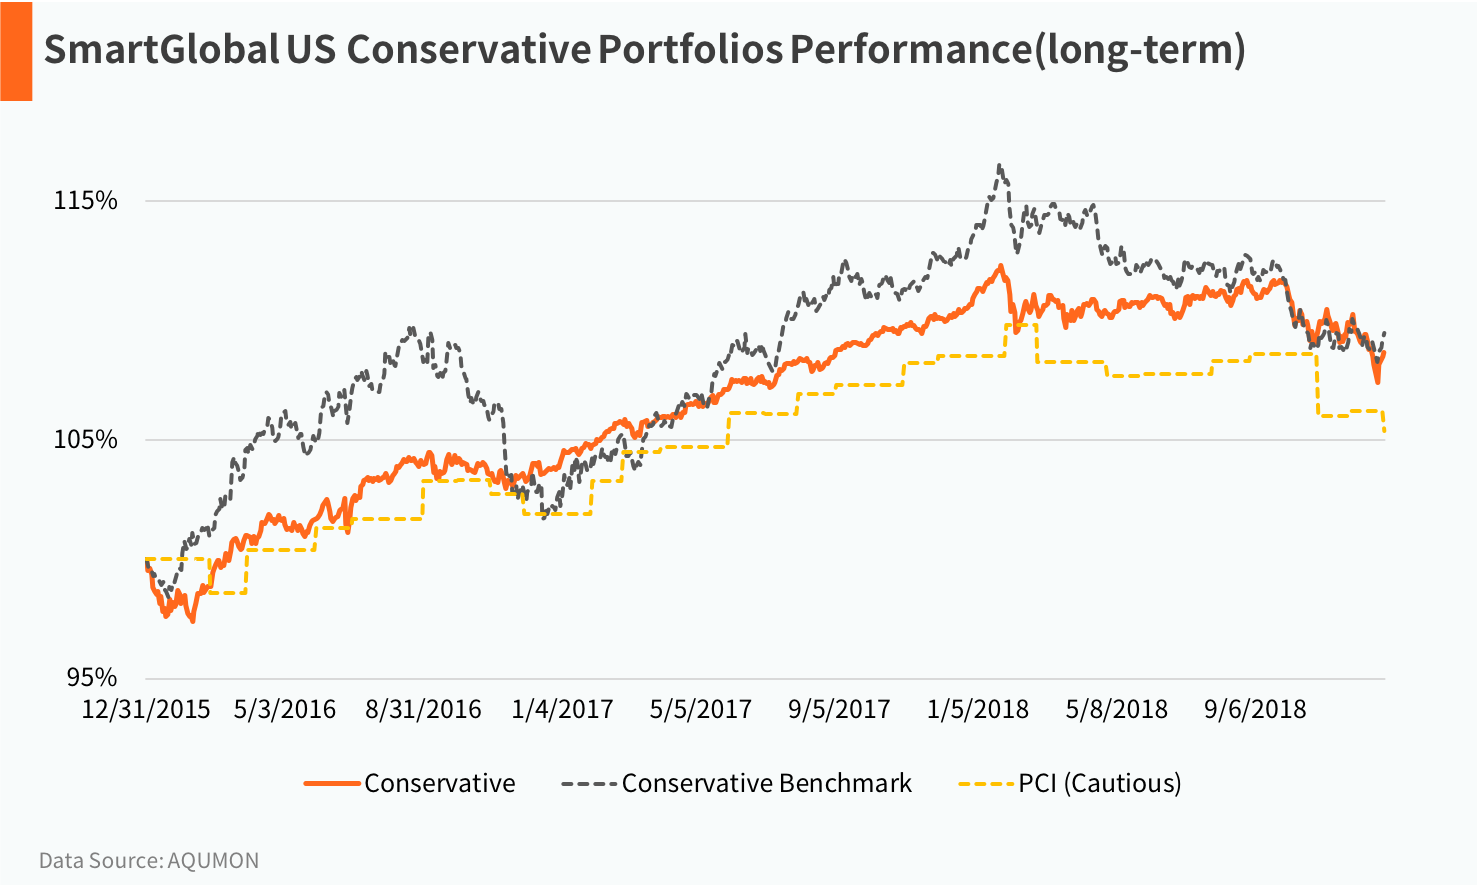
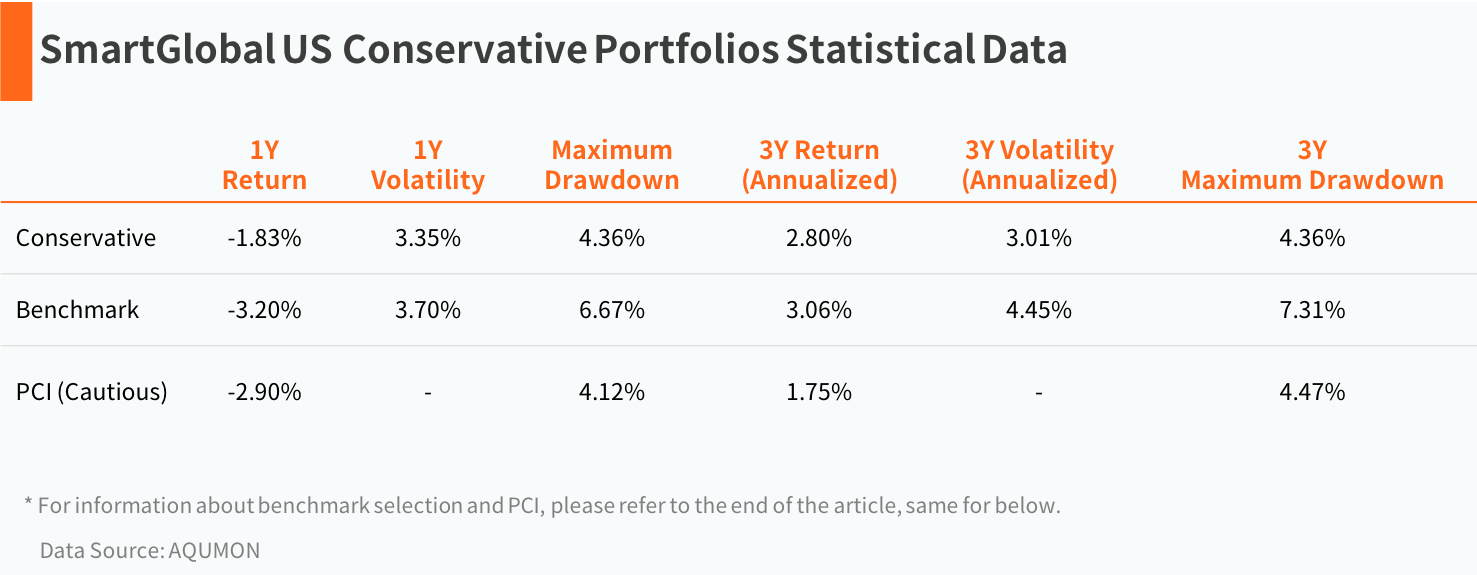
Conservative Portfolio
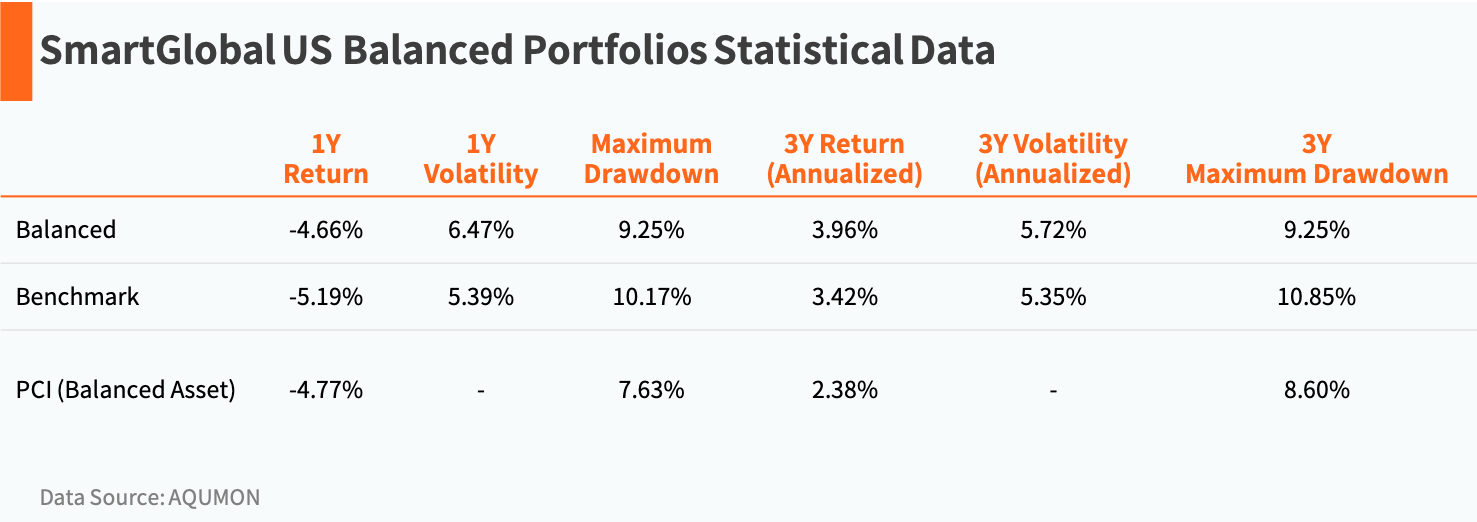
The Conservative Portfolio, due to its high weighting in fixed income products, is the best option for users with low risk preference. It provided a -1.83% annualized rate of return in 2018, exceeding it benchmark by 1.37% and with an outperformance over PCI Cautious Index (-2.90%). The maximum drawdown was 4.36%, lower than the benchmark’s 6.67%. The long-term portfolio performance is close to benchmark’s, which is better than PCI.
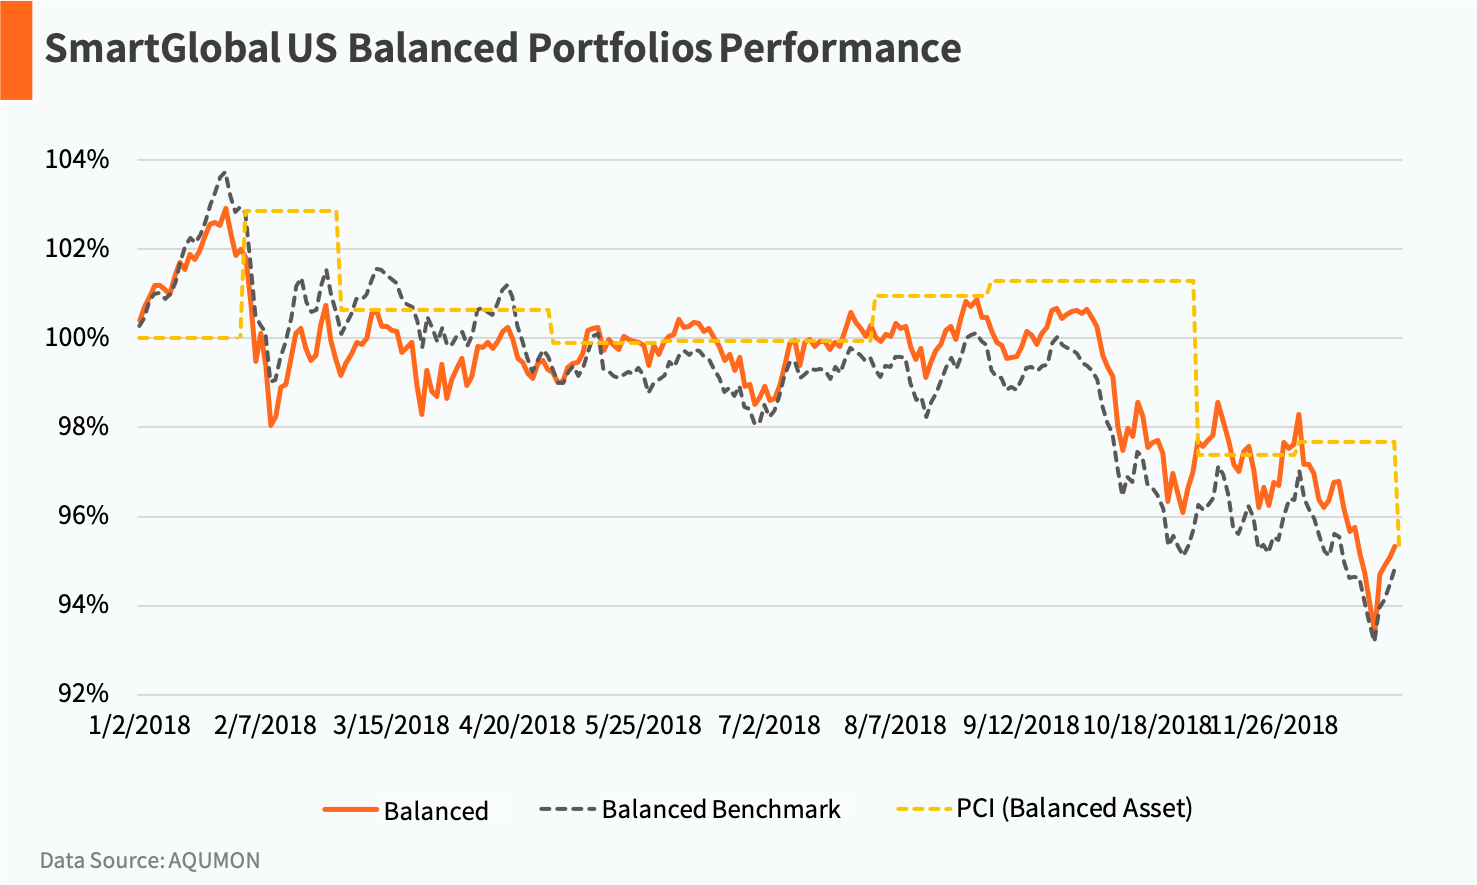
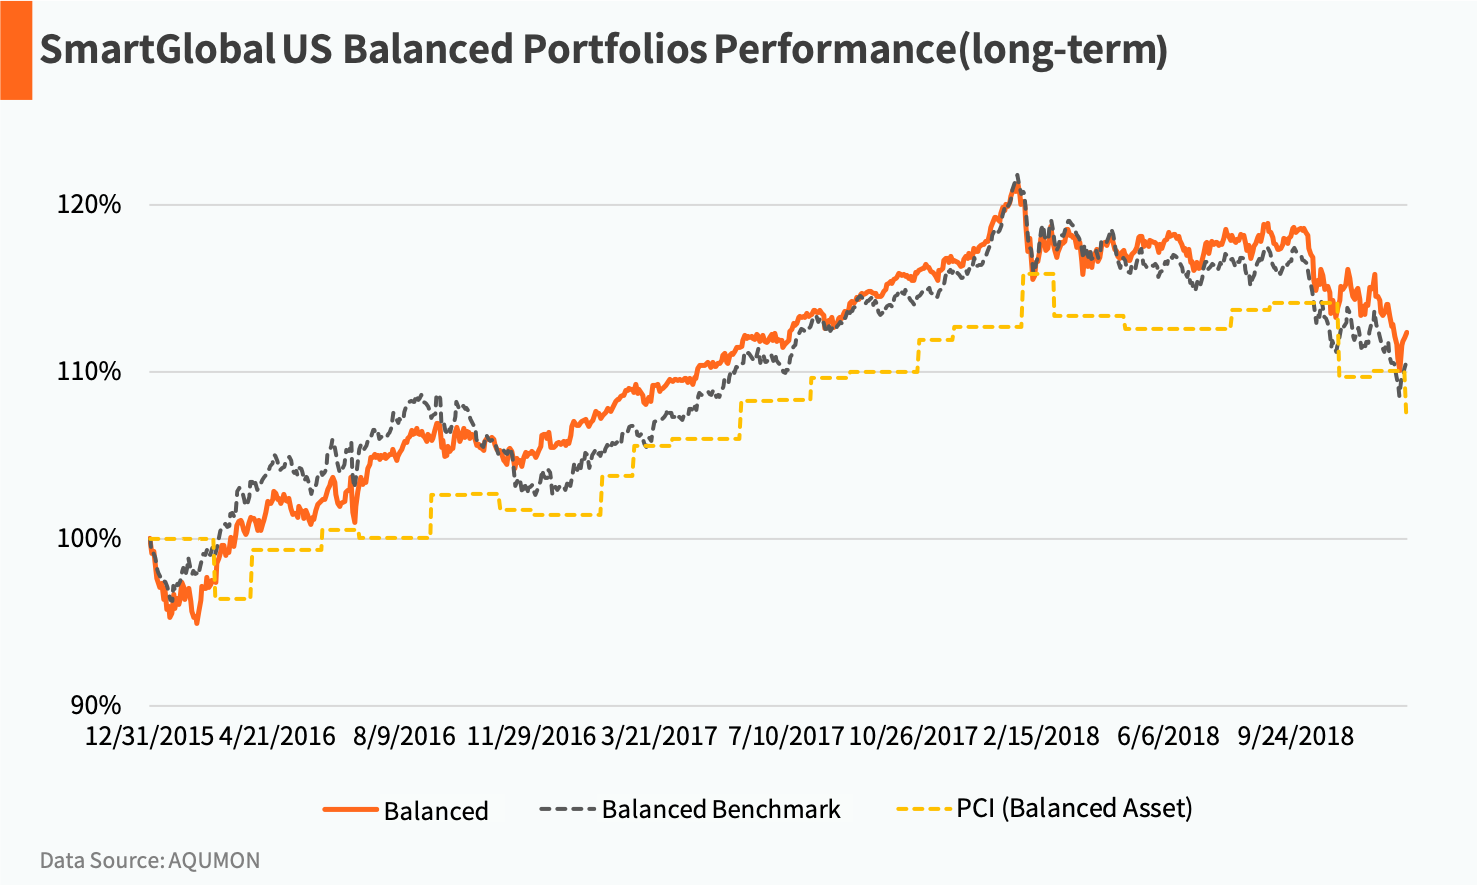
Balanced Portfolio
The Balanced Portfolio is built to find the balance point between risk and profit. It has a proper weighting in both stocks and fixed-income products in order to minimize volatility and diversify inherent risk from stock investments. This portfolio provided a -4.66% annualized rate of return in 2018, exceeding it benchmark by 0.53% and outperforming the PCI Balanced Asset (-4.77%). The long-term portfolio performance is better than both benchmark’s and PCI.
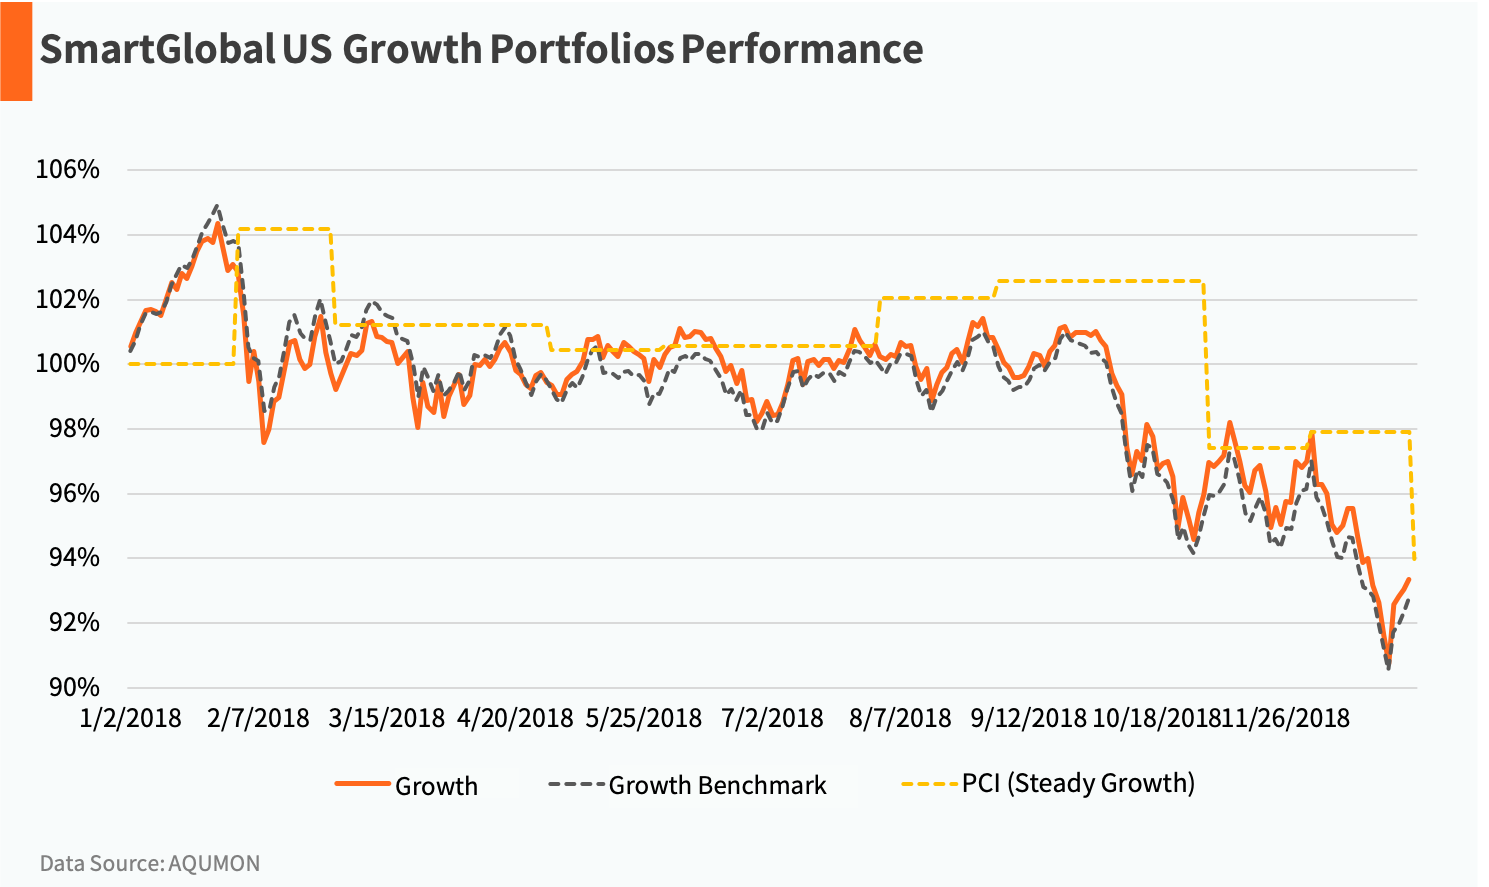
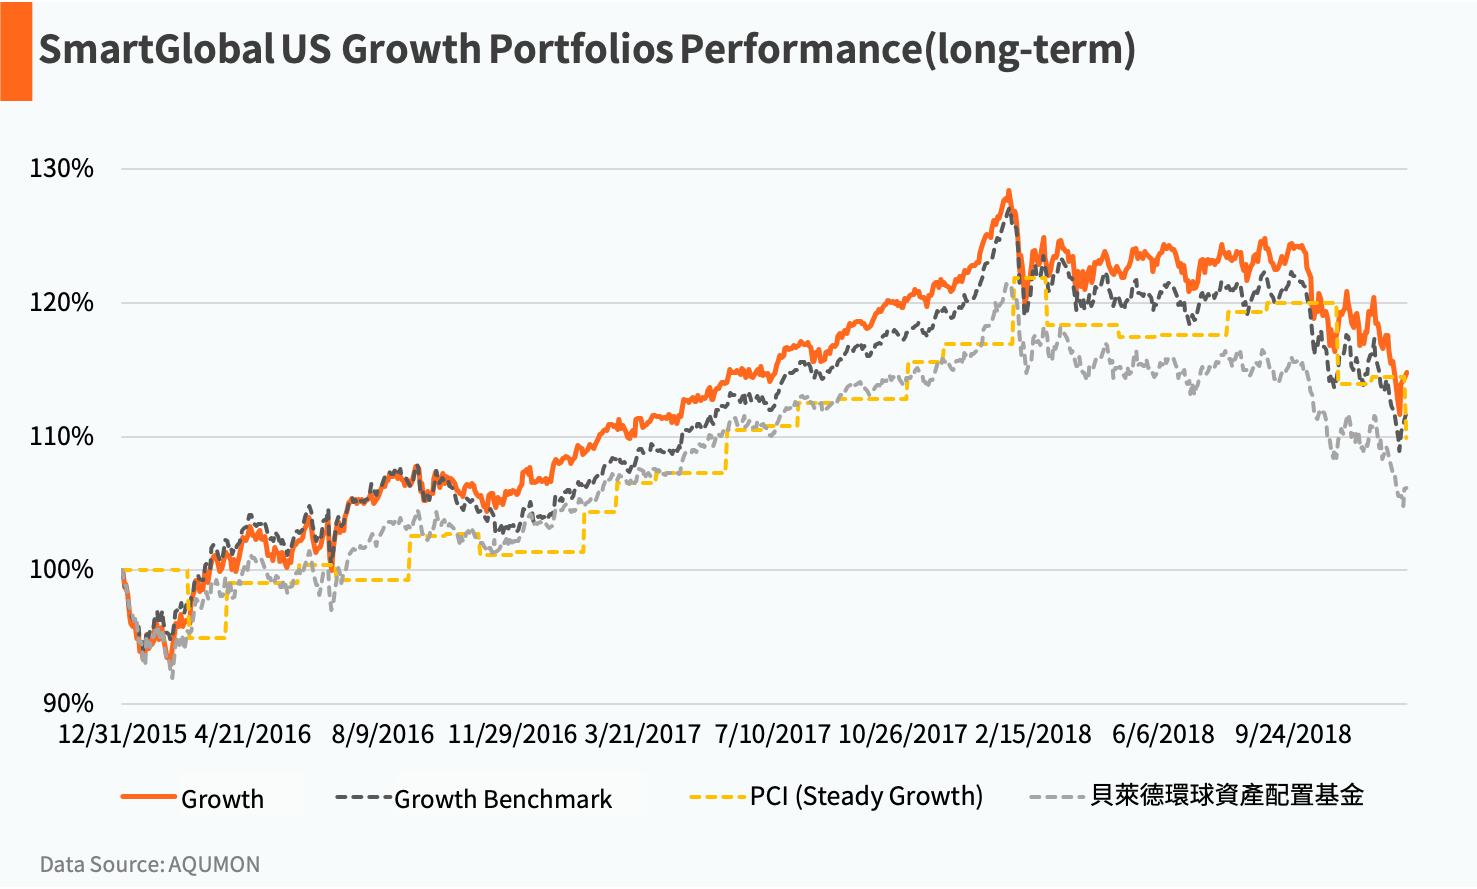
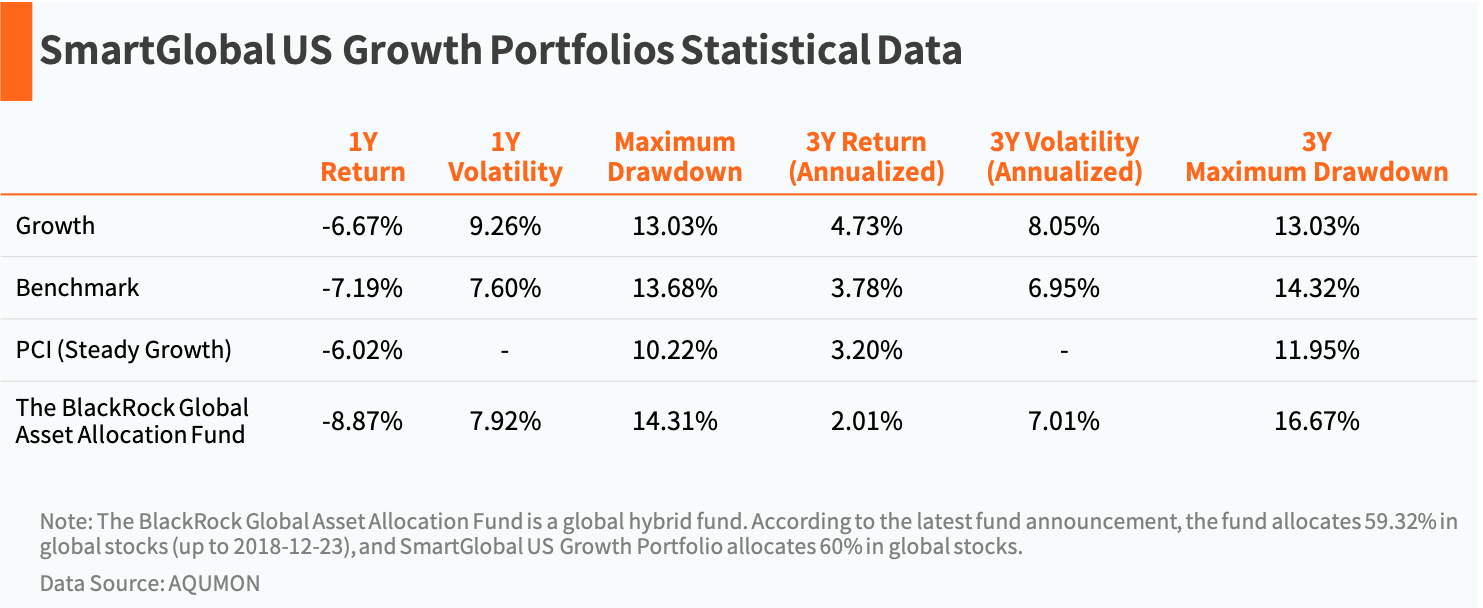
Growth Portfolio
The Growth Portfolio has increased weighting into stocks in order to offer users steady investment return. The fixed-income portion of the portfolio is mainly used to hedge against the stock market risk. This portfolio has achieved a -6.67% annualized rate of return in 2018, exceeding the benchmark’s -7.19% by 0.52% and BlackRock Global Asset Allocation Fund’s -8.87%, and also close to PCI Steady Growth’s -6.02%. The long-term portfolio performance is better than benchmark’s, PCI as well as BlackRock’s.
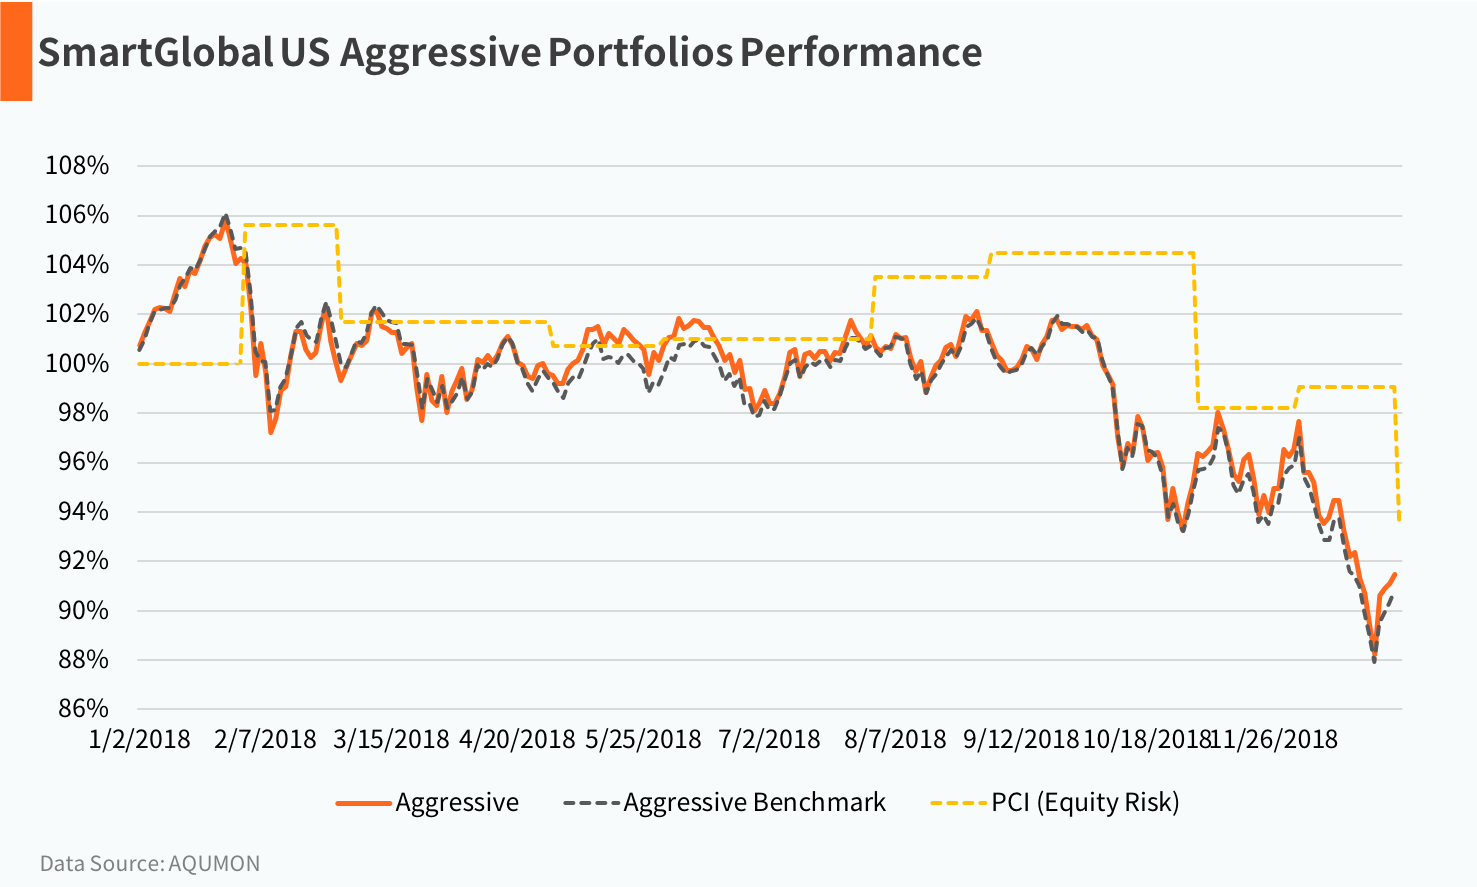
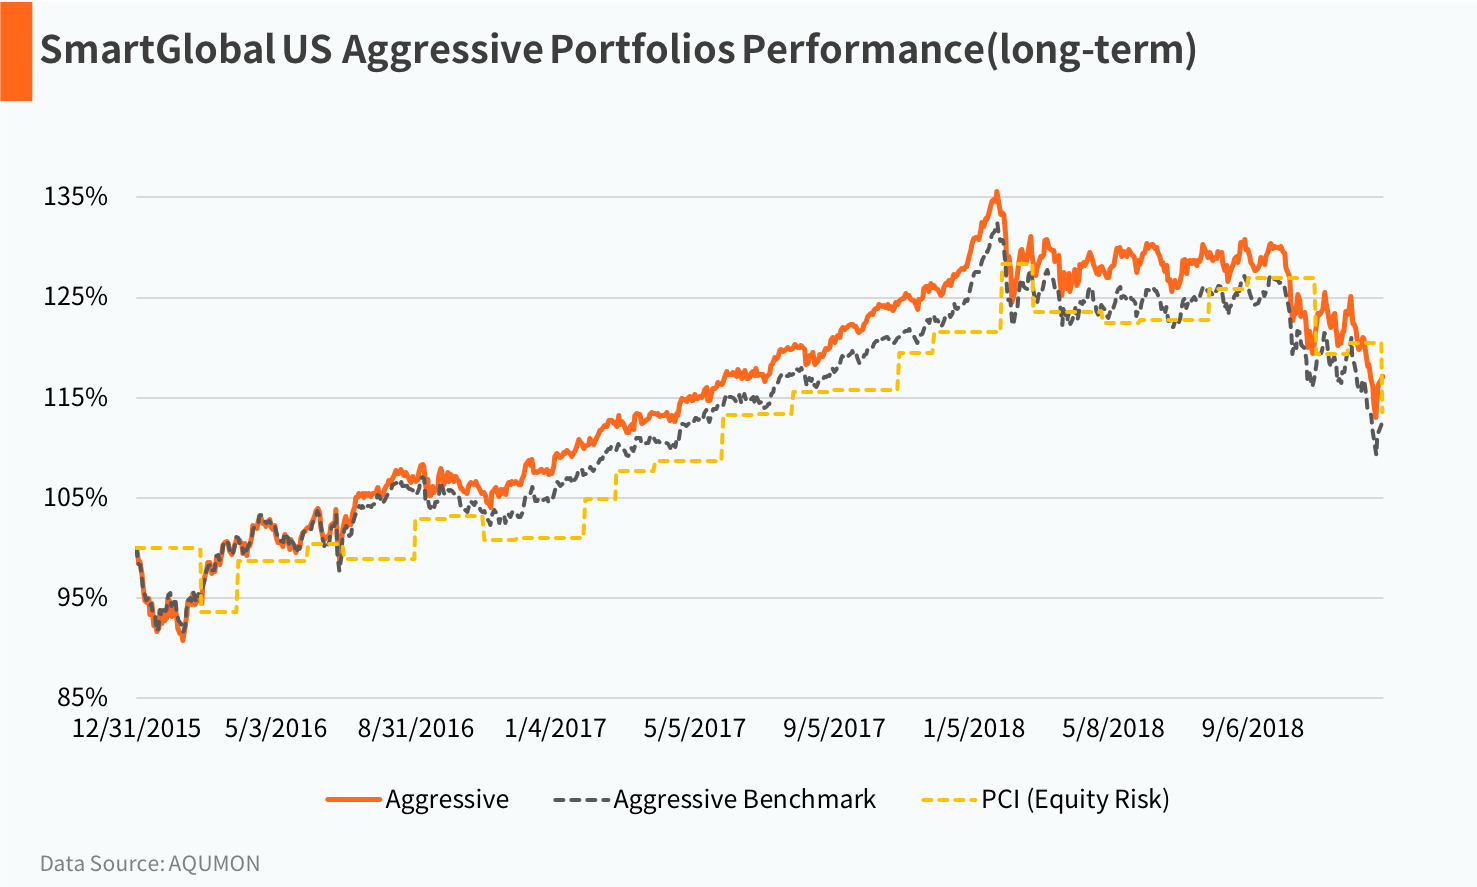
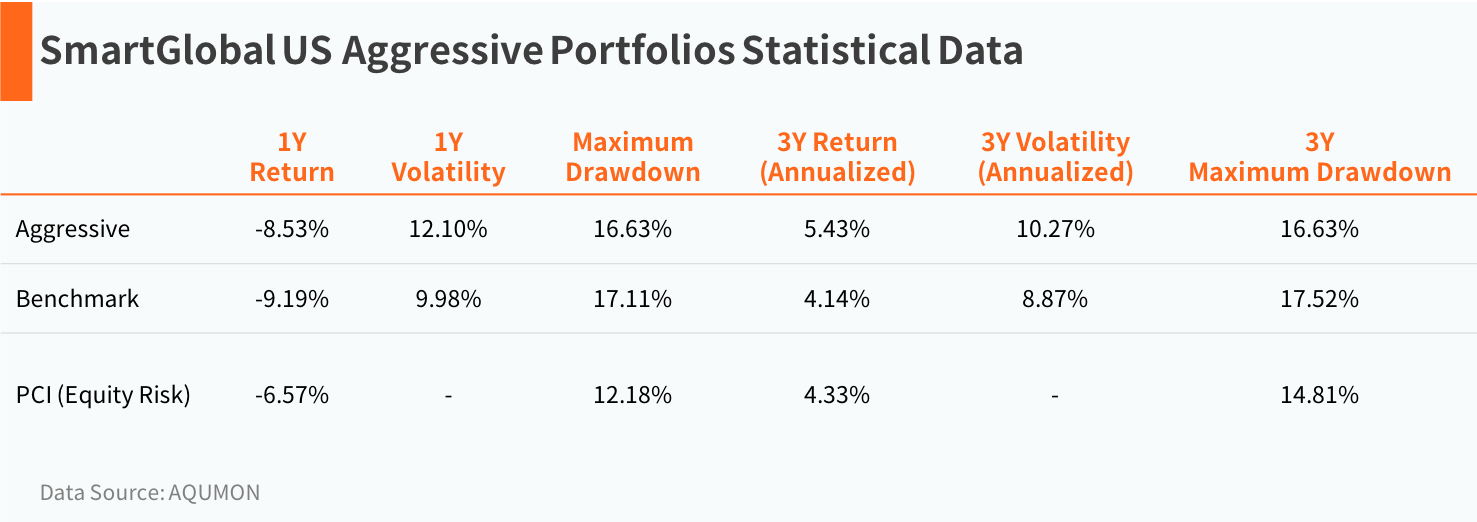
Aggressive Portfolio
The Aggressive Portfolio, due to its high exposure in stock products, is best for investors that are more aggressive and have higher risk preference. This portfolio provided a -8.53% annualized rate of return in 2018, outperforming the benchmarks by 0.26% while lower than PCI Equity Risk’s -6.57%. The long-term portfolio generates better performance than the benchmark’s and PCI.
Disclaimer
Viewers should note that the views and opinions expressed in this material do not necessarily represent those of Magnum Research Group and its founders and employees. Magnum Research Group does not provide any representation or warranty, whether express or implied in the material, in relation to the accuracy, completeness or reliability of the information contained herein nor is it intended to be a complete statement or summary of the financial markets or developments referred to in this material. This material is presented solely for informational and educational purposes and has not been prepared with regard to the specific investment objectives, financial situation or particular needs of any specific recipient. Viewers should not construe the contents of this material as legal, tax, accounting, regulatory or other specialist of technical advice or services or investment advice or a personal recommendation. It should not be regarded by viewers as a substitute for the exercise of their own judgement. Viewers should always seek expert advice to aid decision on whether or not to use the product presented in the marketing material. This material does not constitute a solicitation, offer, or invitation to any person to invest in the intellectual property products of Magnum Research Group, nor does it constitute a solicitation, offer, or invitation to any person who resides in the jurisdiction where the local securities law prohibits such offer. Investment involves risk. The value of investments and its returns may go up and down and cannot be guaranteed. Investors may not be able to recover the original investment amount. Changes in exchange rates may also result in an increase or decrease in the value of investments. Any investment performance information presented is for demonstration purposes only and is no indication of future returns. Any opinions expressed in this material may differ or be contrary to opinions expressed by other business areas or groups of Magnum Research Limited and has not been updated. Neither Magnum Research Limited nor any of its founders, directors, officers, employees or agents accepts any liability for any loss or damage arising out of the use of all or any part of this material or reliance upon any information contained herein.