

Selecting ETF: A Cost Perspective (Part II)
Written by Walter & Yufei on 2019-03-18
ETF is perhaps the best instrument for passive investment, but as we can see, elimination of active management does not render active investment research futile. Conducting research on underlyings, developing portfolio strategy and monitoring investment are as important as ever.
In our previous article"Selecting ETF, a cost perspective (part I)" we conducted a simple analysis based on three critical assumptions:
- Investor is a Hong Kong Tax resident
- The investor is only interested in Ireland and U.S. domiciled funds.
- We disregard the investor level tax discrepancies, as we always do in this article
Suppose that we relax the first two assumptions, then the scope of the analysis would be expanded on two levels:
- We need to analyze the total costs of ownership for ETFs domiciled in not only Ireland and U.S., but also other regions, such as Luxembourg and Hong Kong.
- For investors with different tax residences, we would need to consider TCOs differently. This is again because on the fund level, investor’s tax residence and ETF domicile collectively determine withholding tax rates. In other words, instead of confining our analysis to Hong Kong investors, we now need to include investors from other jurisdictions, such as Mainland China.
In the following section, we will give 8 examples where it may be advisable to switch from one ETF to another for TCO reasons. Our recommendations below are given to two different sets of investors, Hong Kong and Mainland China, although in practice, the number of cases would be much greater.
Our Recommendation Based on TCO analysis
If I want to invest in S&P 500?
Suppose an investor wants to invest in S&P 500, perhaps the most well-known index anywhere in the world, he or she will be faced with many different ETFs, including eight that are domiciled in Hong Kong, Ireland, Luxembourg, and the United States (Chart 1). So how does the investor choose amongst the eight popular ETFs?
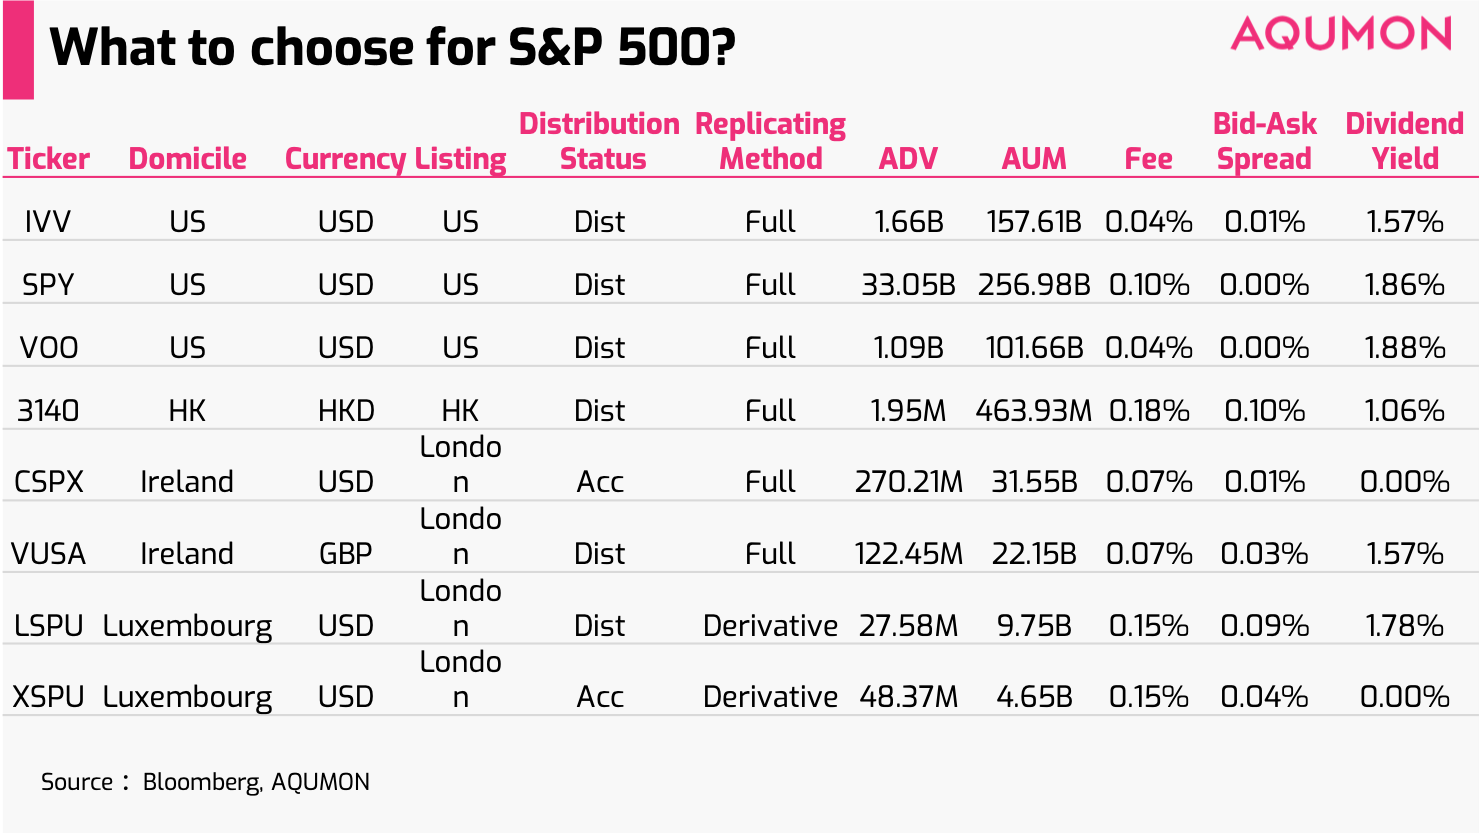
*Chart 1
As we know, the performance of the ETFs are very much closely linked to S&P 500 so the most critical factor that we need to consider is Total Cost of Ownership. However, this is far from being a simple issue.
As we discussed earlier, different withholding tax rates apply to different investors, as can be seen from Chart below:
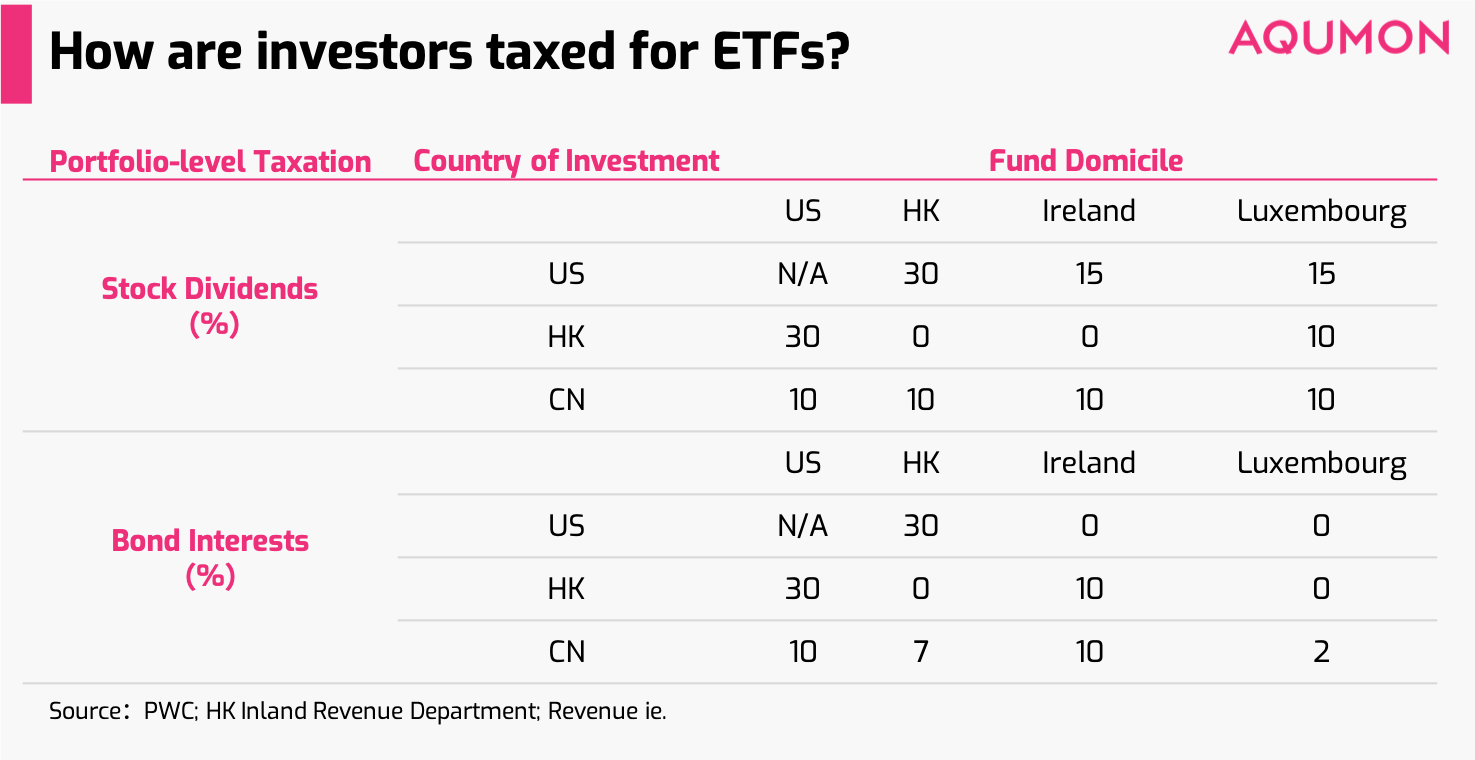
*Chart 2
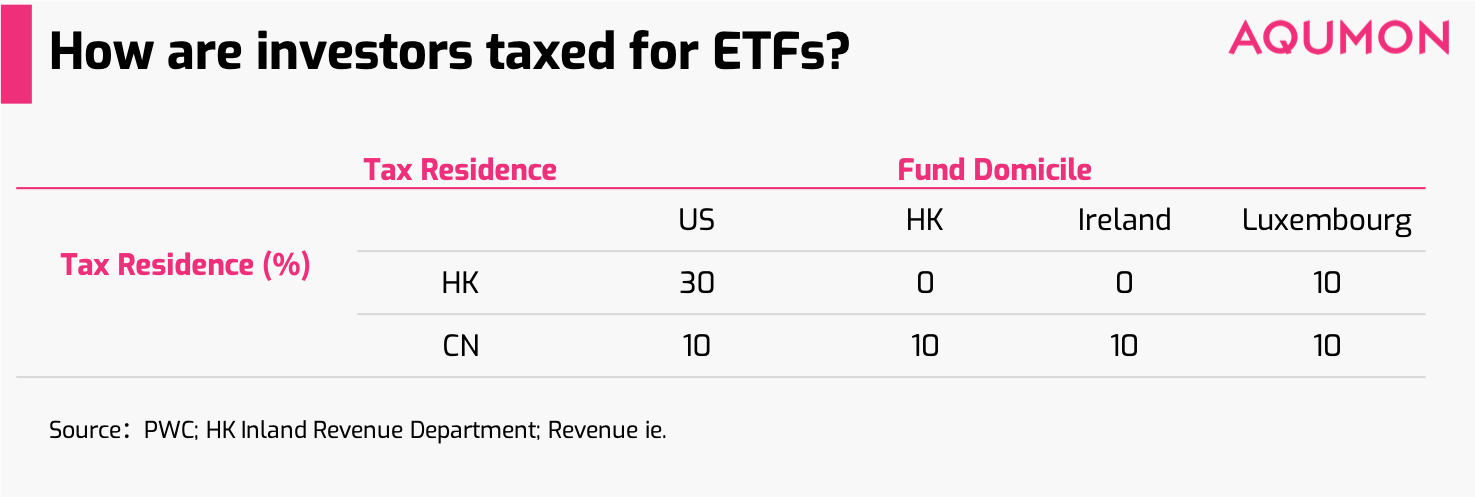
*Chart 3
From Chart 2-3 above we can analyze how fund level taxation will vary for Mainland China and Hong Kong investors:
- Mainland China: for all four of the popular ETFs domiciles, China have a 10% fund level taxation rate.
- Hong Kong: We can see that fund-level taxation is at 0 for both Hong Kong and Ireland Domiciled ETFs; for US Domiciled ETFs, taxation is as much as 30%. Luxembourg charges 10% fund-level tax for Hong Kong investors.
From a portfolio level taxation perspective, we can also see tax rate varies with the region in which investment underlyings are located. Notice that bond interests and stock dividends are taxed differently at this level: China taxes Hong Kong domiciled funds 7% for bond interests payments and 10% for dividends. Similarly, US charges Ireland domiciled funds 0% for interests but 15% for stock dividends: this explains the reason why in AQUMON’s latest iteration of SmartGlobal Max portfolio, only fixed income, but not equity, ETFs were switched to Ireland domiciled ones.
A comparison case of Mainland and Hong Kong Investors for S&P 500
To Further digest the above graph, let’s look at two cases:
- Hong Kong investors wanting to invest in S&P 500 --- Chart 4
- Mainland China investor wanting to invest in S&P 500 --- Chart 5
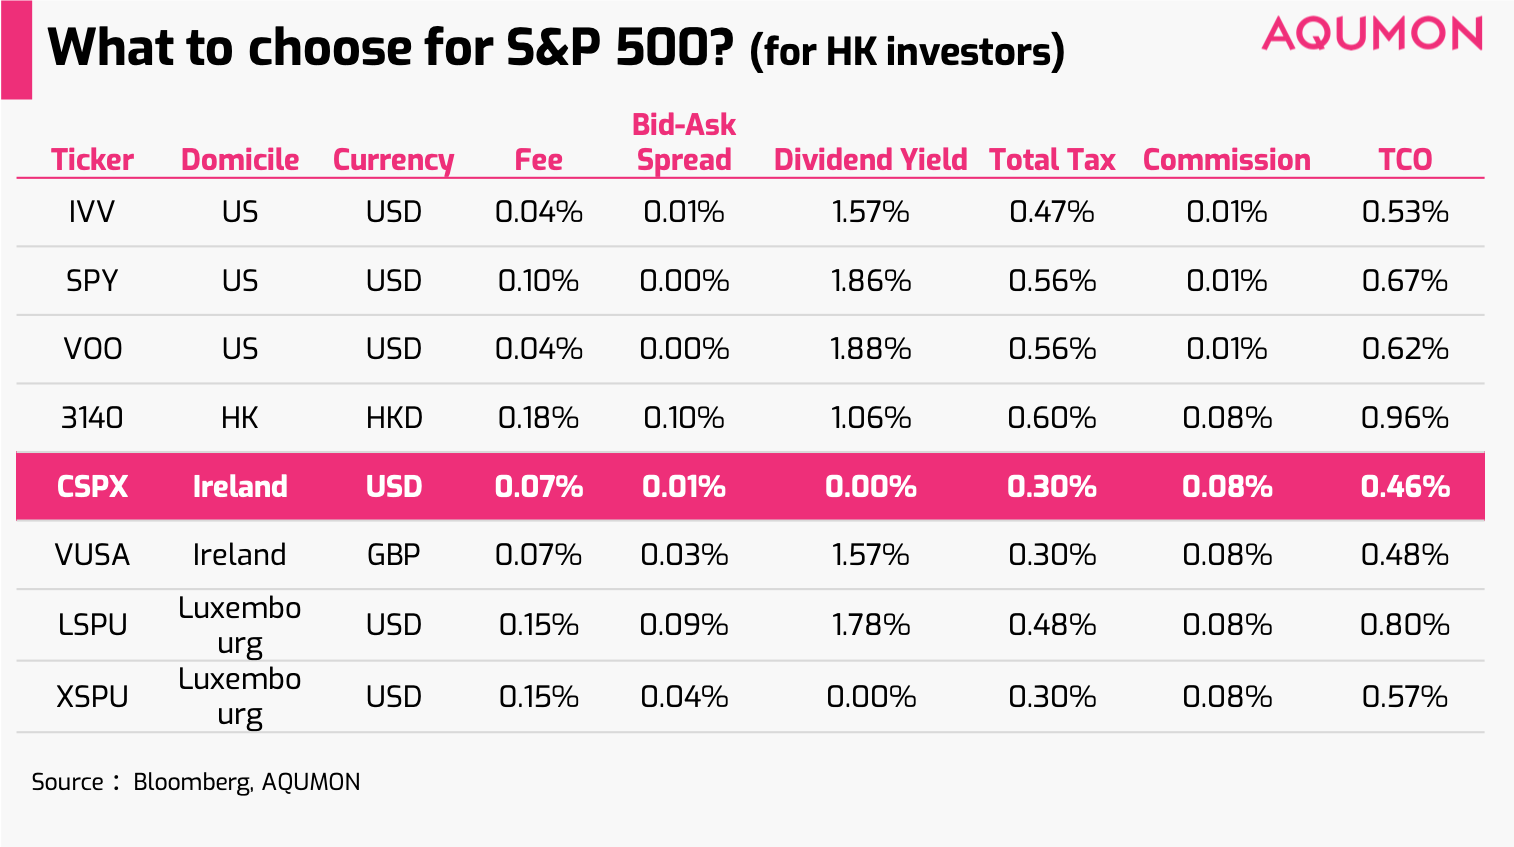
*Chart 4
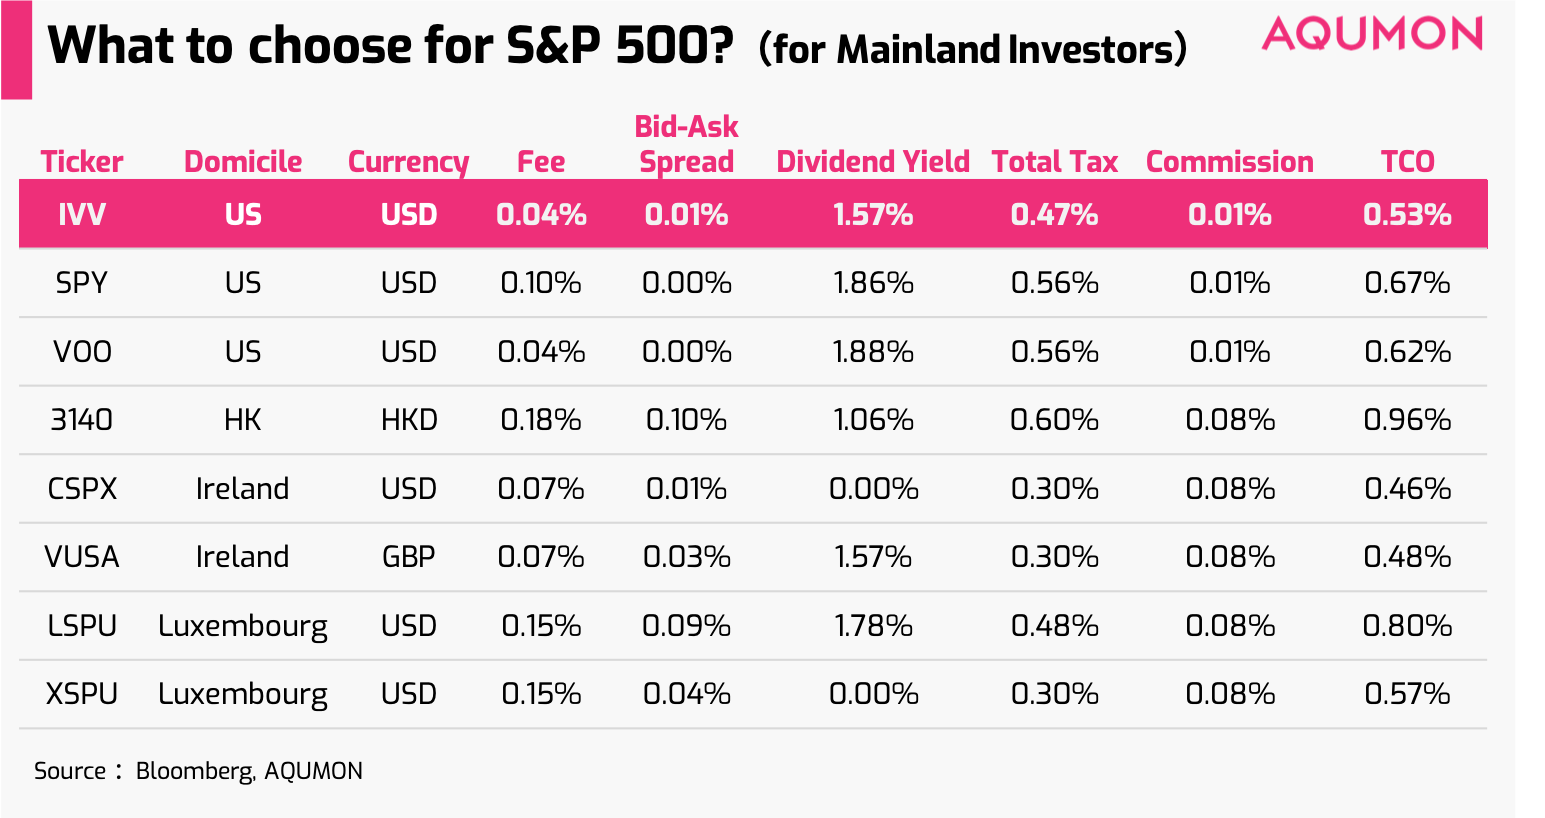
*Chart 5
From a TCO standpoint, because Mainland China and Hong Kong investors incur different fund level taxation, the resulting optimal TCOs are also different. For Mainland China investors, using US-listed IVV is optimal whereas for Hong Kong investors, CSPX has the lowest TCO.
If we compare IVV with CSPX, we find that despite the fact that CSPX is a more expensive in management fees, for Hong Kong investors its tax benefits are large enough to overcome its cost disadvantage: for Hong Kong investors, the Fund level taxation is 0% with Ireland domiciled ETFs. On the other hand, the tax advantage diminishes with Mainland China investors: for such investors, fund level taxation is 10% rather than 0%. This is the reason why we choose IVV instead of CSPX in the case of Mainland investors.
An example of High Yield Bond ETFs
Let’s consider a different case where investors are looking into investing Markit Iboxx USD Liquid High Yield Capped Index, an index that tracks high yield bonds. The two ETFs that represent the index are HYG and IHYA, as can be seen from Chart 6.
As it turns out, for both Mainland China and Hong Kong Investors, Ireland-listed IHYA has superior cost metrics, despite being substantially less liquid.
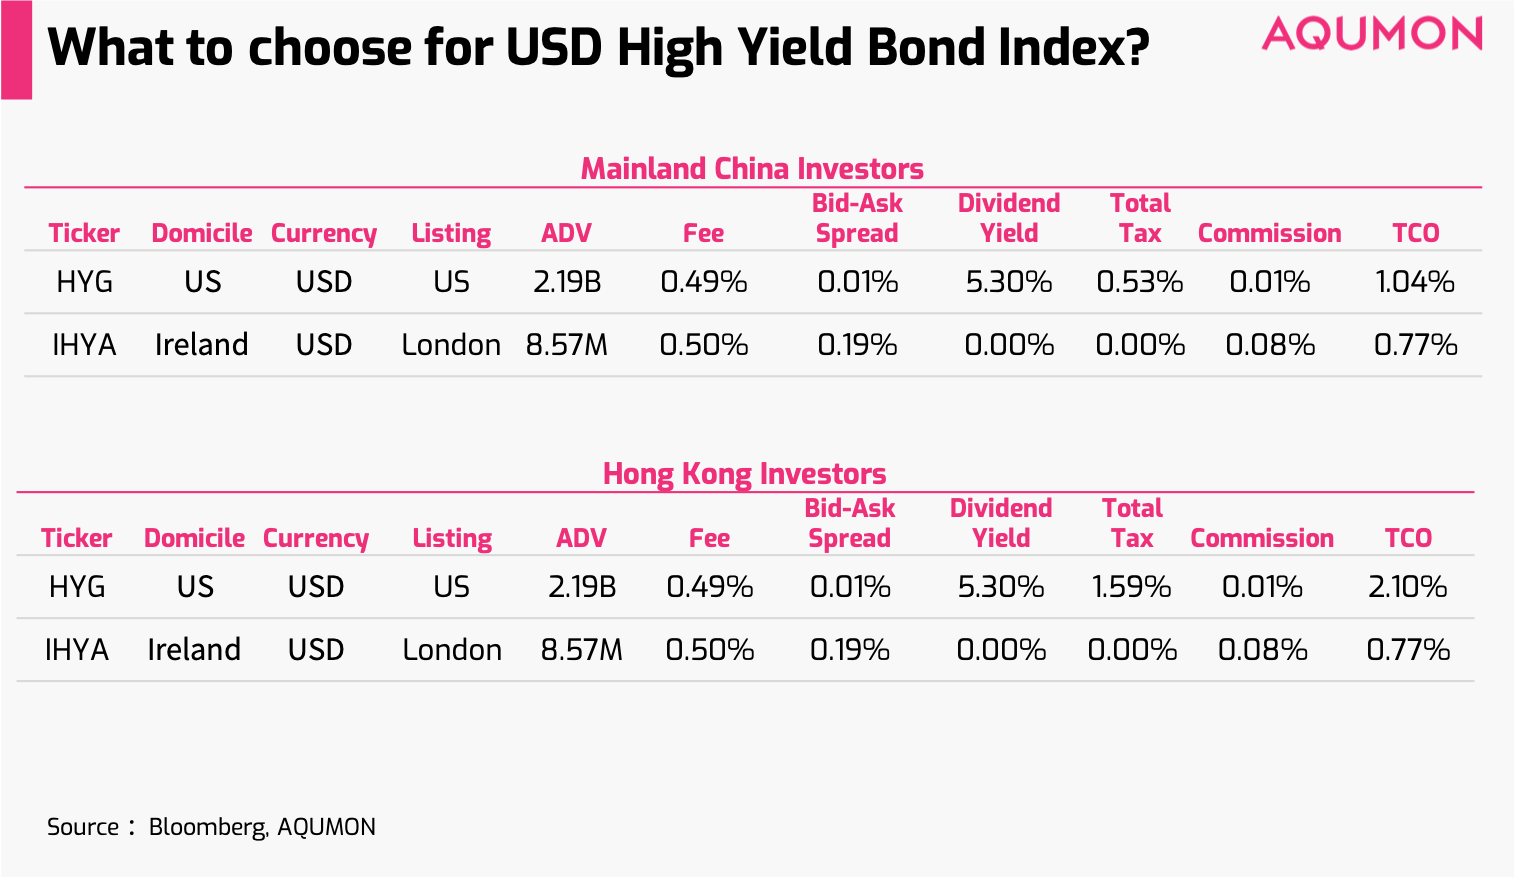
For both Mainland and Hong Kong investors, there are neither portfolio level nor fund level taxation for Ireland domiciled IHYA. Nevertheless, US domiciled HYG has total tax rates of 53 and 159 bps, for Mainland China and Hong Kong investors respectively. The management fees of IHYA and HYG are similar and in the end the tax advantage of IHYA proved too difficult to surpass, despite having substantially higher liquidity costs of 19 bps vs 1 bp.
Recommendations on 4 sets of popular ETFs
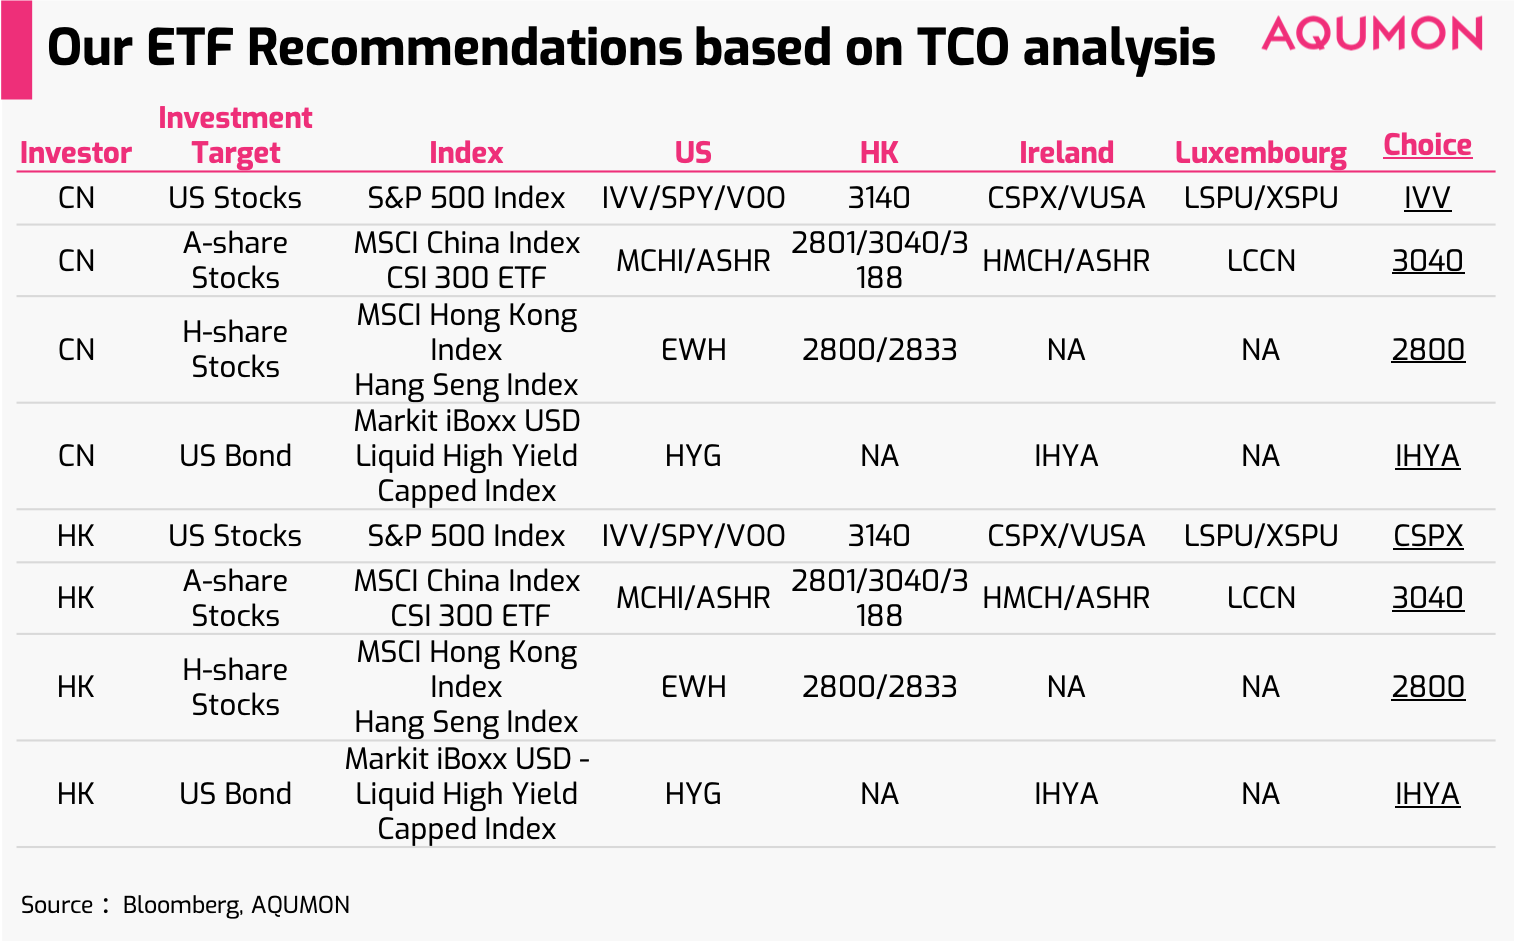
In summary, we have conducted similar analysis on a total of 4 sets of indices: US Large Cap, China A-share, Hong Kong H-share and US High Yield Bond in Chart 7. After conducting TCO analysis for both Hong Kong and Mainland investors, we have arrived at the following recommendations:
Note that in reaching such conclusions, we have made a few assumptions, which may not always reflect actual costs of holding. For example, we have used historical bid-ask spread as an indicator for how much spread investors may actually pay. This indicator may not always be accurate, especially for large orders in an illiquid market. At the same time, we have not regarded the differences between index-level dividend yields and ETF-level dividend yields as part of TCO. ETF issuers uses different replication methods, such as equity swaps, full replication and partial replication. Unfortunately, partial replication or swaps often lead to shrinked dividend payments.
Consequently, ETF dividend yields may differ from index-level dividends. We have not included such differences as part of the TCO because we find many relevant data to be unreliable. Also, some ETF issuers may, after end of financial year,partially rebate withholding tax back to investors. However, whether they actually do rebate and how much they rebate is a matter of uncertainty. While the analysis could be further improved, we have found that by systematically analyzing different costs of holding ETFs, the calculation has very reliably enhanced take-home returns for our Robo-advisory investors.
Again, there are a myriad of ETF choices for investors and we believe in the importance of conducting due diligence on financial investments. Indiscreet choices of ETFs can be quite costly to investors: in our previous case of S&P 500 index ETFs, the differences between the lowest and highest TCO can be as large as 86 bps on a yearly basis. The number is much higher with fixed income ETFs: in our case of HYG vs IHYA for Hong Kong investors, a choice on the wrong side would cost them a whopping 133 bps.
ETF is perhaps the best instrument to achieve passive investment, but as we can see, elimination of active management does not render active investment research futile. Conducting research on underlyings, develop portfolio strategy and constantly monitoring investment are as important as ever.
Disclaimer
Viewers should note that the views and opinions expressed in this material do not necessarily represent those of Magnum Research Group and its founders and employees. Magnum Research Group does not provide any representation or warranty, whether express or implied in the material, in relation to the accuracy, completeness or reliability of the information contained herein nor is it intended to be a complete statement or summary of the financial markets or developments referred to in this material. This material is presented solely for informational and educational purposes and has not been prepared with regard to the specific investment objectives, financial situation or particular needs of any specific recipient. Viewers should not construe the contents of this material as legal, tax, accounting, regulatory or other specialist of technical advice or services or investment advice or a personal recommendation. It should not be regarded by viewers as a substitute for the exercise of their own judgement. Viewers should always seek expert advice to aid decision on whether or not to use the product presented in the marketing material. This material does not constitute a solicitation, offer, or invitation to any person to invest in the intellectual property products of Magnum Research Group, nor does it constitute a solicitation, offer, or invitation to any person who resides in the jurisdiction where the local securities law prohibits such offer. Investment involves risk. The value of investments and its returns may go up and down and cannot be guaranteed. Investors may not be able to recover the original investment amount. Changes in exchange rates may also result in an increase or decrease in the value of investments. Any investment performance information presented is for demonstration purposes only and is no indication of future returns. Any opinions expressed in this material may differ or be contrary to opinions expressed by other business areas or groups of Magnum Research Limited and has not been updated. Neither Magnum Research Limited nor any of its founders, directors, officers, employees or agents accepts any liability for any loss or damage arising out of the use of all or any part of this material or reliance upon any information contained herein.