

Hedge Market Risk: Benefits of Diversified Portfolios
Written by Qing & Ria on 2019-08-13
Recently, the demand of averting market risks has increased sharply, together with the falling prices of risk asset. As of August 13, CSI 300 Index had fallen by 5.29%, while the S&P 500 index had fallen by 3.27%.
Since this May, the biggest thrust to pull the stock market trend is the trade war between China and the US, with several heavyweight gains and losses all started from here.
The Fall in August could also be interpreted as a normal market response to the escalation of trade war coinciding with expectations of Fed interest rate cut.
Looking back at 2018, several plunges were largely against investors’ enthusiasm. Under the pressure of the approaching Bear Market, many investors wonder how the market will react and whether we should add on or not.
Therefore, we will answer questions for investors from the following points. In order to facilitate the quick reading, we also list the conclusions in advance:
Q1: Is AQUMON's global asset allocation still effective during this plunge?
- Yes.
Q2: What is the key to resisting risk?
- Low correlation.
Q3: How will the market change? How should I invest?
- The speculative prediction is not advisable. However, according to statistics, the probability of rebound after plunge is also very high (after a two-week drop of 7%, there is a 69% chance of rebounding in the next two months).
Individual investors are advised to hold for a long time instead of focusing on short-term ups and downs.
Firstly, let's take a look at how AQUMON asset allocation portfolios performed during this period of volatility.
Take SmartGlobal Max that invested by in US ETFs as an example, the major stock index drawdown was relatively high throughout May, while SmartGlobal Max portfolio remained a steady rising trend with only a tiny fluctuation. With a general market index drawdown of 6% to 8%, the maximum drawdown of a robust portfolio is only 1.3%.
This is the impressive record that global asset allocation can achieve.
Asset allocation is a scheme that diversifies investment in large-scale financial assets such as stocks, bonds, and alternative investments. Moreover, the global asset allocation is to expand the geographical scope of the underlying assets to the global level, thereby avoiding the risk of a single market.
The maximum drawdown mentioned above is an important risk indicator in investment analysis, mainly to measure the risk tolerance of the account in the worst case. The calculation formula is: max (1 - the current value of the account / the highest value of the account before the date) * 100%.
How does AQUMON SmartGlobal Max portfolio hedge against risk?
From the above comparison of the performance of Smart Global Max and the general market index, it can be clearly seen that global asset allocation can effectively achieve risk control (low risk drawdown).
The key to AQUMON risk resistance is low correlation. In other words, while focusing on return on assets, AQUMON will select less relevant assets and optimize asset weights, thereby achieving global asset allocation.
Let us look at the differences between high-relevance assets portfolio and low-relevance assets portfolio.
Selecting three stocks of HSI constituents to form portfolio 1, while AQUMON's Smart Global Max portfolio was used as portfolio 2. The correlation and volatility of each in the portfolio were calculated according to the past year (2018.07.31~2019.08.01).
The following figure is the conclusion of these two portfolios:
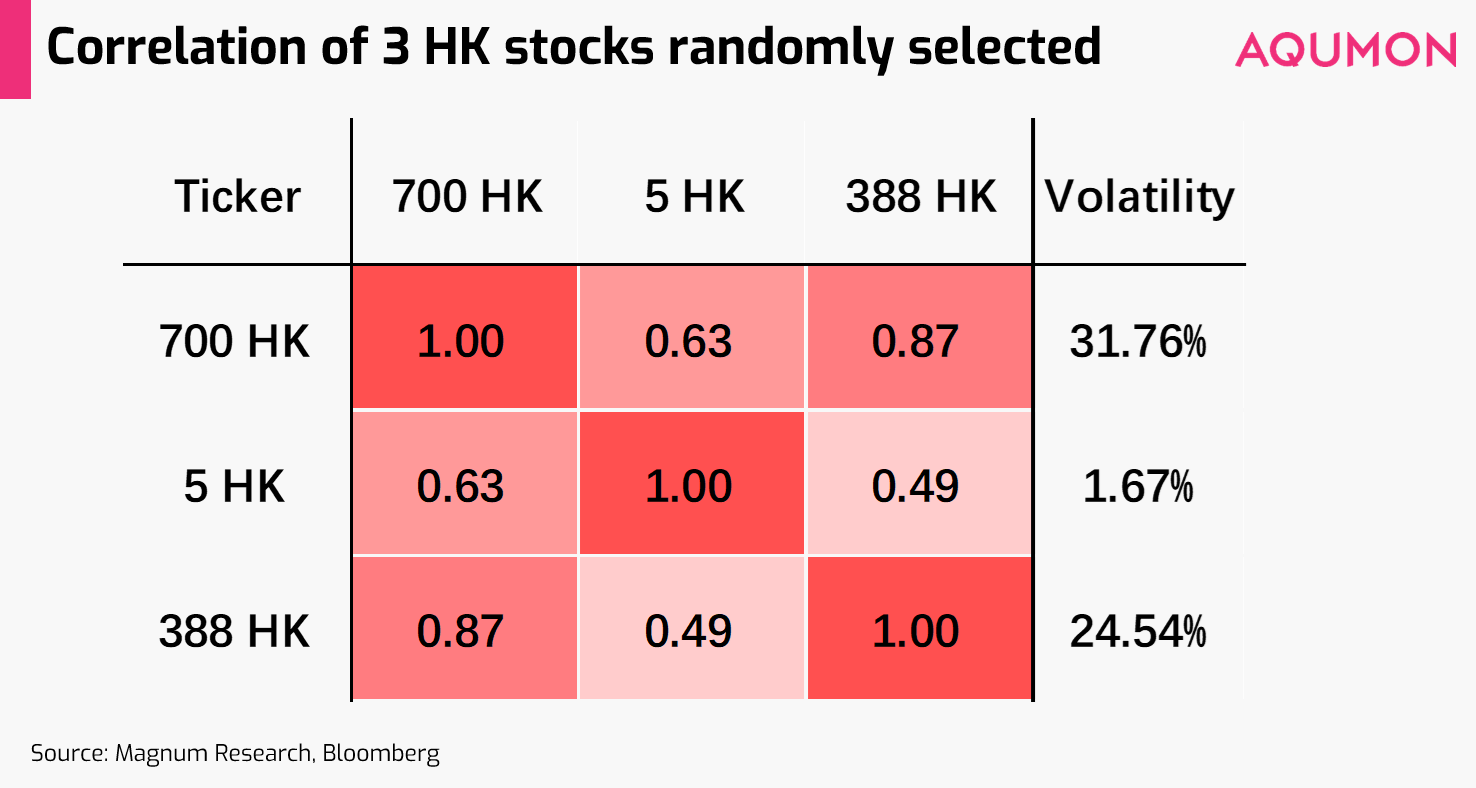
The red color indicates stronger positive correlation, and the rightmost column indicates the volatility of the asset.
Due to the relatively limited funds of retail investors, we simulated the perspective of retail investors and randomly selected three stocks of HSI constituents, namely Tencent Holdings (700 HK), HSBC (5 HK) and HKEx (388 HK).
These three stocks are already from different industries, but the actual results are:
- Their correlation is still high. In other words, it is difficult to achieve the effect of spreading risk.
- The randomly selected asset correlations are positive.
- It is very likely that some investment targets with higher volatility will be selected. For example, Tencent Holdings in the portfolio has a volatility of 31.76%.
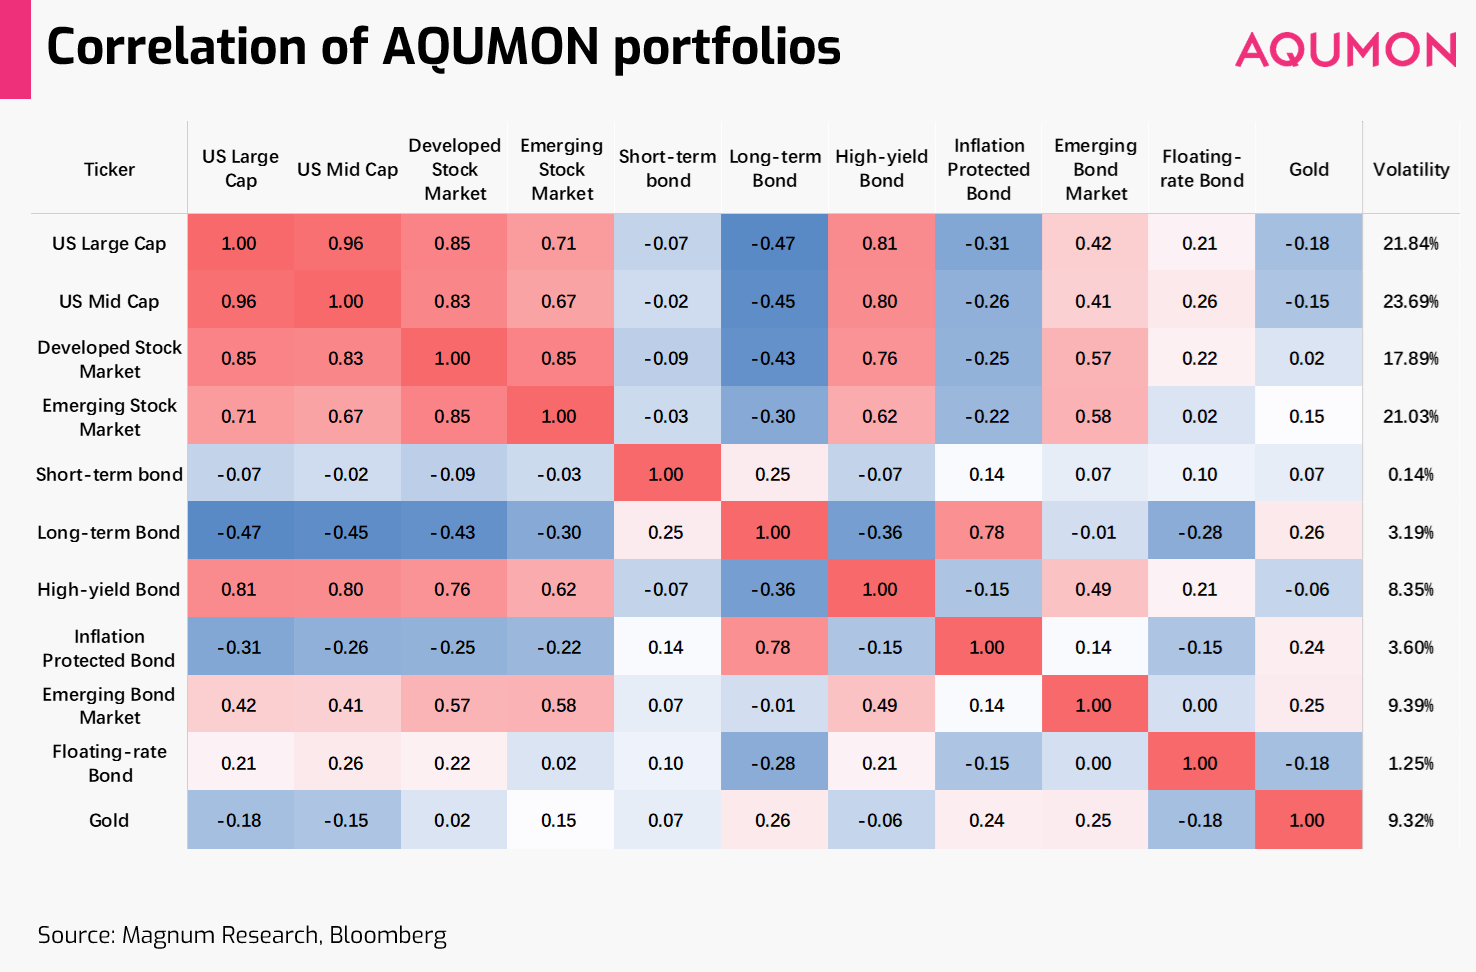
The figure above shows the correlation between the components of the Smart Global Max portfolio. The more reddish the color, the stronger the positive correlation, and the blue color indicates a negative correlation.
It serves to show:
- All selected assets have relatively low volatility, all below 24%.
- The correlation between the underlying assets selected by AQUMON is low, even negative.
- There is still a high correlation between some assets that belong to the US market. But for the sake of profitability, they are still included in the portfolio, where AQUMON controls the risk by adjusting the weight of highly correlated assets in the algorithm.
By comparing the correlation matrix of the stochastic stock portfolio of a single market with AQUMON and the corresponding volatilities, we can see that AQUMON's smart portfolio shows the advantages of low correlation and low volatility.
But as investing portfolios, earnings is also an important factor to consider. In the recent unstable market environment, the yield rates of the two types of portfolios are as follows.
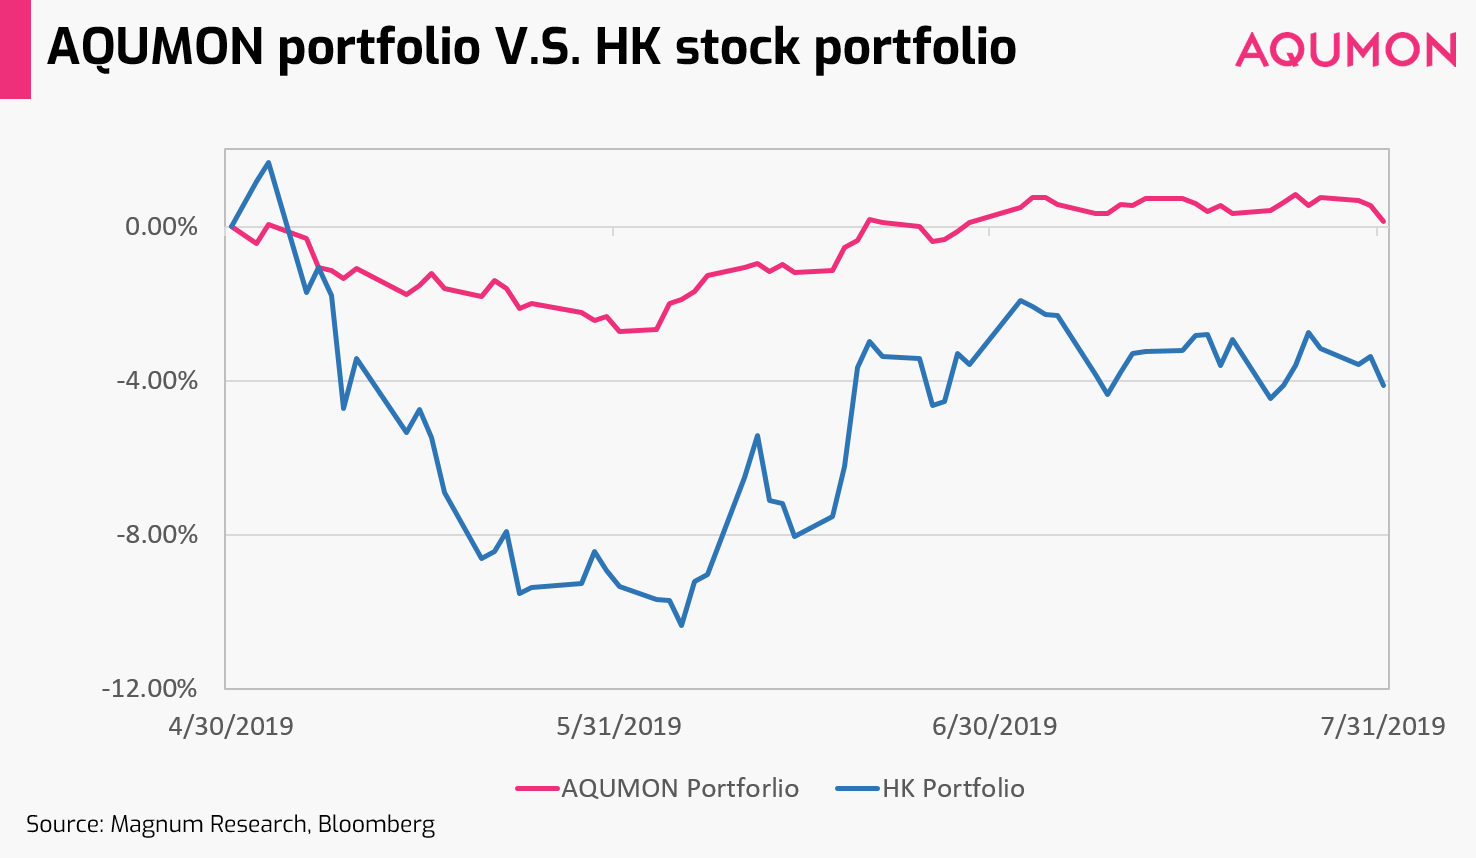
In May, market volatility intensified. Comparing the stochastic stock portfolio of a single market with AQUMON portfolio, the stock portfolio earnings were flat at the beginning of August.
This is because in the later configuration of assets, AQUMON optimizes the weight according to Markowitz's theory in addition to the low correlation and low volatility standards, thereby pursuing the maximum profit under low volatility.
Then let’s return to the last question, how will the market change?
Everyone would like an expert to tell you whether the market will go up or down tomorrow, but they won't tell you how long this will last (how long it will rise or how long it will fall).
We have always advocated that individual investors view investment from a long-term discipline perspective and avoid being influenced by personal emotions. In August, Sino-US friction escalated, which lead to a tense market. However, from a statistical point of view, the market plunging will only last for a short period in general, and the follow-up is often accompanied by a market rebound.
Since the beginning of 1990, the S&P 500 index has experienced declines in 7% in two weeks for 33 times and 69% probability rebound in the following two months. The average annualized rate of return during the two months was nearly 30%.
From the end of 2010 to August 2019, the S&P 500 index saw a total of nine sharp declines, but the market gradually stopped falling and then rose further. The average recovery period was 70.35 transaction days.
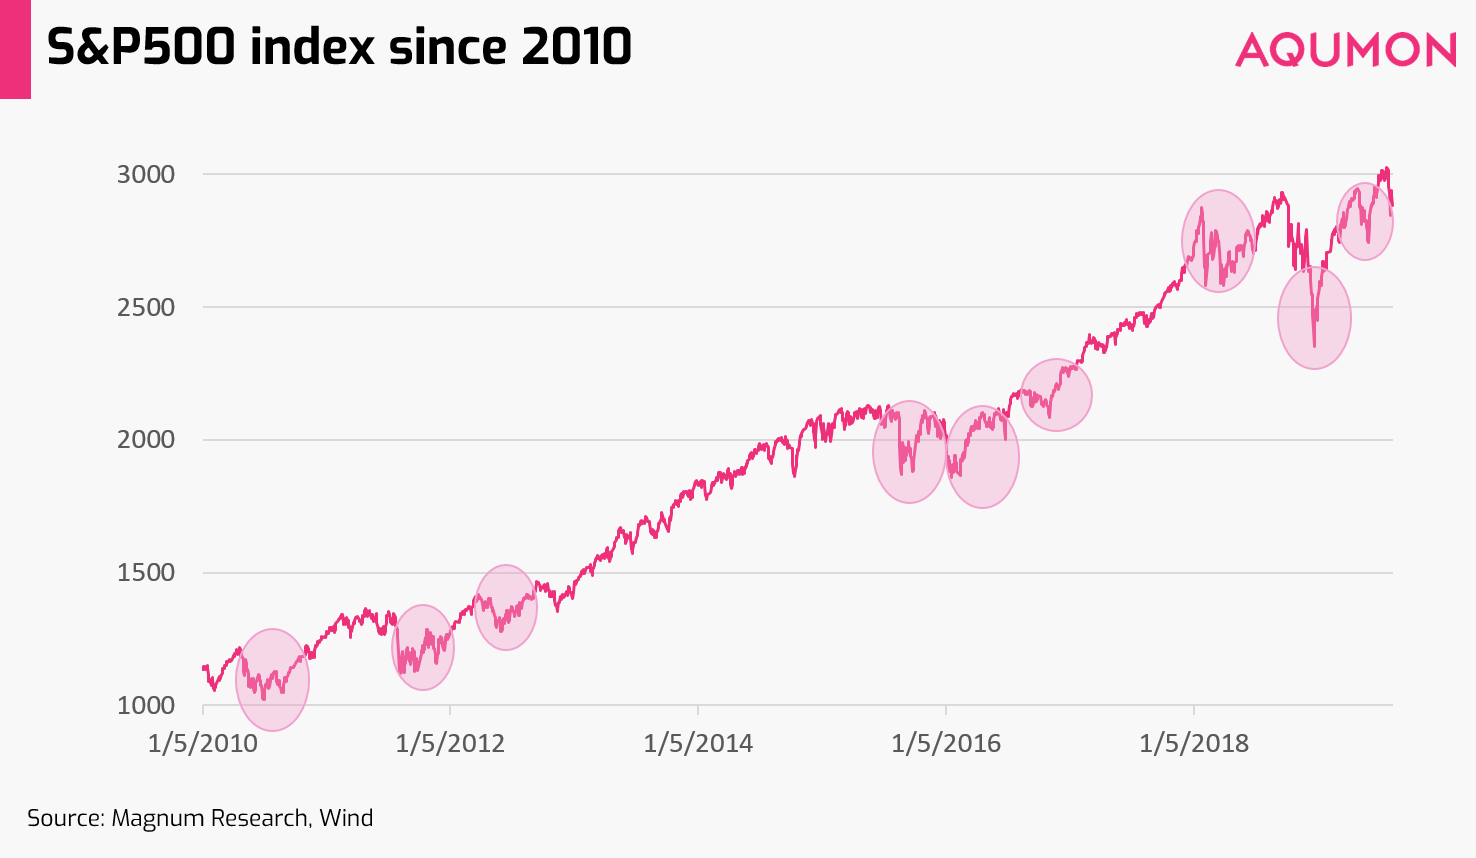
Therefore, individual investors should stay calm, rather than rushing out at low points.
Here is an old saying of the financial industry, "Stay calm and stay invested", as an old Chinese poem goes, “see beyond the floating clouds and appreciate the long vista”.
If you are worried about making mistakes in investment due to personal emotions, the best choice is to focus on long-term investment and diversified portfolios.
Disclaimer
Viewers should note that the views and opinions expressed in this material do not necessarily represent those of Magnum Research Group and its founders and employees. Magnum Research Group does not provide any representation or warranty, whether express or implied in the material, in relation to the accuracy, completeness or reliability of the information contained herein nor is it intended to be a complete statement or summary of the financial markets or developments referred to in this material. This material is presented solely for informational and educational purposes and has not been prepared with regard to the specific investment objectives, financial situation or particular needs of any specific recipient. Viewers should not construe the contents of this material as legal, tax, accounting, regulatory or other specialist of technical advice or services or investment advice or a personal recommendation. It should not be regarded by viewers as a substitute for the exercise of their own judgement. Viewers should always seek expert advice to aid decision on whether or not to use the product presented in the marketing material. This material does not constitute a solicitation, offer, or invitation to any person to invest in the intellectual property products of Magnum Research Group, nor does it constitute a solicitation, offer, or invitation to any person who resides in the jurisdiction where the local securities law prohibits such offer. Investment involves risk. The value of investments and its returns may go up and down and cannot be guaranteed. Investors may not be able to recover the original investment amount. Changes in exchange rates may also result in an increase or decrease in the value of investments. Any investment performance information presented is for demonstration purposes only and is no indication of future returns. Any opinions expressed in this material may differ or be contrary to opinions expressed by other business areas or groups of Magnum Research Limited and has not been updated. Neither Magnum Research Limited nor any of its founders, directors, officers, employees or agents accepts any liability for any loss or damage arising out of the use of all or any part of this material or reliance upon any information contained herein.