

Does a Inverted Yield Curve Mean a Recession Coming?
Written by AQUMON Team on 2019-10-17
Since the bubble burst in 2000, and the Global Financial Crisis in 2008, market players have long believed that an inverted yield curve is one of the leading signals of a coming recession.
Does the US’ inverted yield curve necessarily predict a coming recession? Does this negatively impact asset pricing? Are there investments which are not affected by the yield curve inversion?
AQUMON algorithm team utilised a statistical analysis approach to investigate the predictive ability of selective local yield spreads (difference between their 1-to-10 year treasury yields) and the impact on various financial assets, including equity, fixed income, foreign exchange, crude oil and gold providing our readers with a mathematical-based recommendation on how to invest during this period.
To briefly summarize our core findings:
◇ Fixed income market: except for China, the US, UK, and EU fixed income markets are sensitive to the magnitude of their local yield spread. But an inverted US yield curve will not cause the fixed income market to go down continuously.
◇ Stock market: statistically only the US stock market may decline 12 and 18 months after a shrinking local yield spread. Only the US and the UK stock markets will generate less-than-previous returns 18 months after an inverted US yield curve.
◇ Gold market: relatively insensitive their local yield spread.
◇ Foreign exchange market and crude oil market: insensitive to local yield spread.
Based on the expectation of the Federal Reserve’s (Fed) continued monetary easing policies, we believe in the short term, there is a reduced chance for a crash in equity or fixed income markets. Our findings show that the inverted US yield curve’s effect on such markets is statistically limited. In contrast, events including Sino-US trade war, Brexit, and Saudi oil field explosion have more apparent impact on market volatility and should be something we suggest our clients should closely monitor.
It is difficult to predict a Black Swan Event, and investors’ efforts to predict the market based on certain potential “signals” tend to be ineffective. Therefore, we still recommend individual investors to best reduce their portfolio’s investment risks through global diversification.
Why US yield spread is so important?
The yield curve represents the yield available for bonds of equal credit quality under different maturity dates. In general, the yields of short-term bonds are considered to be lower than those of long-term bonds. What factors impact the yield curve?
The short end of a yield curve is mainly affected by monetary policy decisions because central banks set the level of the shortest-term interest rate – the Federal funds rate.
For long-term interest rates, however, the determinants are more varied. The expected hypothesis states that long-term interest rates are the final reflection of all investors’ expectation of future short-term interest rates.
Compared with short-term bonds, long-term bonds tend to carry more liquidity risks, inflation, and credit risks, etc. Long-term investments are compensated for these risks and uncertainties, and thus, in a healthy economy, long-term interest rates should be higher than short-term ones. Once a deviation of the curve occurs, it is usually a signal of potential turning points in the economy.
The relations between domestic yield spread and markets
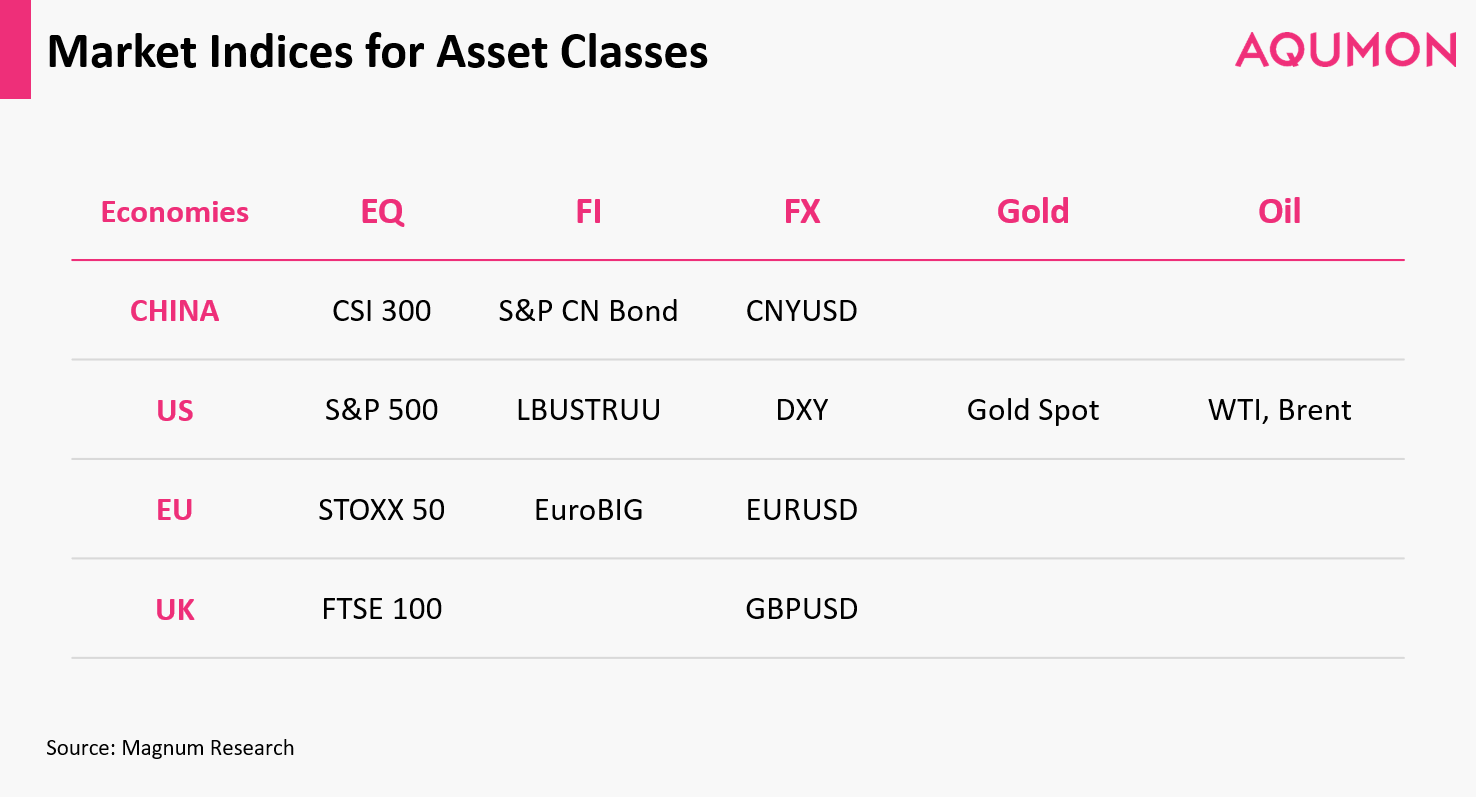
To better understand the impact of yield spread, AQUMON’s algorithm team investigate the relationship between the certain regional yield spreads since 2000 and their impact on a group of financial assets, including equity, fixed income, foreign exchange, crude oil and gold. For such yield spread, we adopted the corresponding local yield spread between the 10-year treasury and the 1-year treasury.
We selected the following indices for each asset class, and applied two statistic methods to our analysis:
- Linear Regression: to regress the holding period returns over the local yield spread and local1-year treasury yield to see what is the impact, if any, to asset returns.
- Logistic Regression: to regress the indicators of market pullbacks over the local yield spread and local 1-year treasury yield to see if there is any correlation to a subsequent market pullback.
1.Stock Market
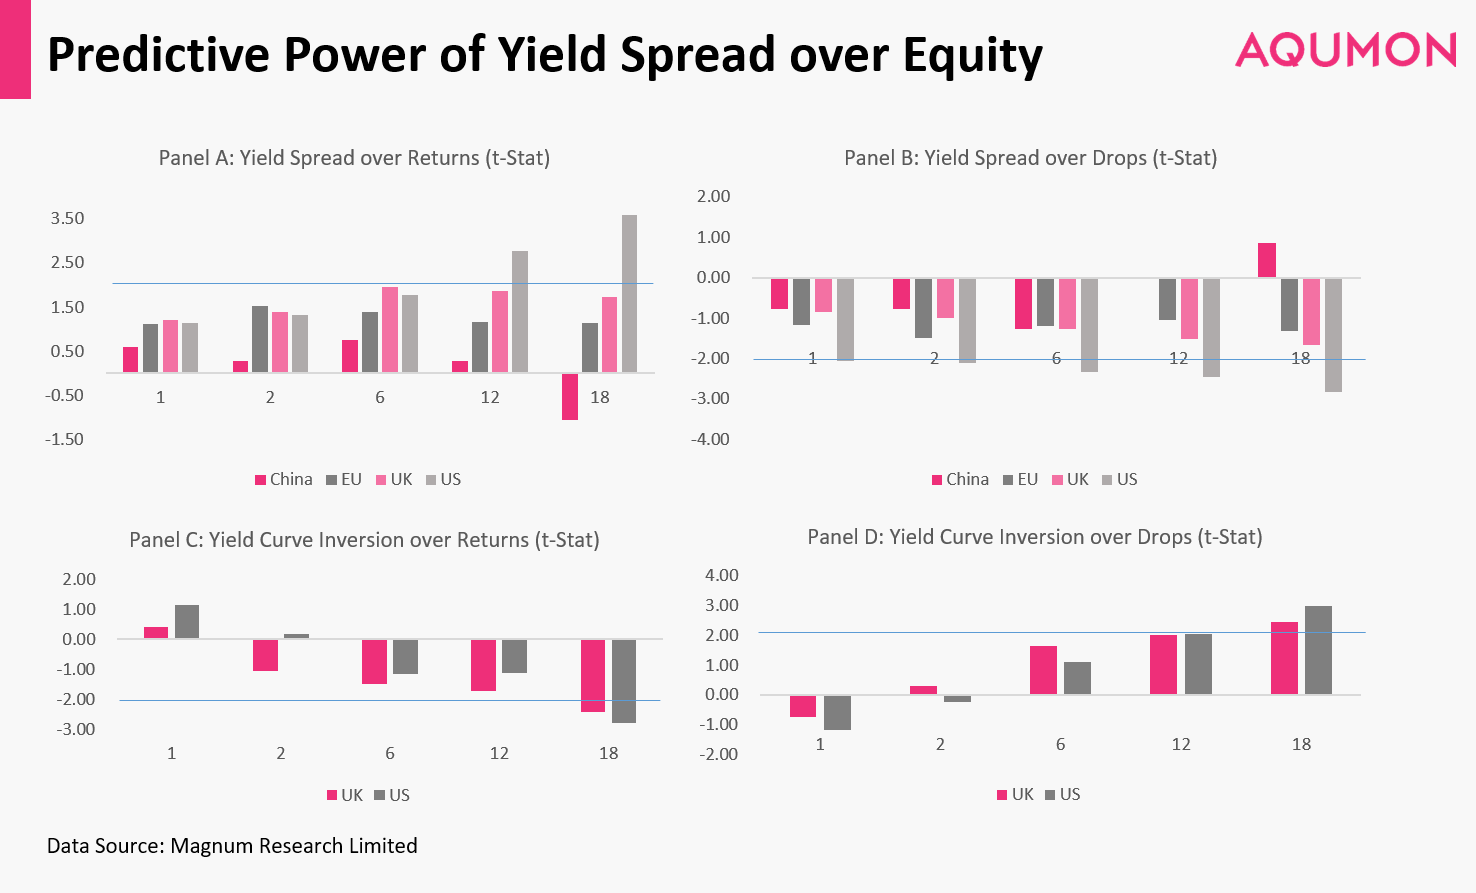
Surprisingly, yield spread does not present statistically significance when using it to predict the outcome of the equity market.
The first row of the figure above indicates that the US yield spread cannot predict the likelihood of market drops for the equity markets of China, EU, and UK. However, the local yield spread can statistically predict the returns of the US equity market (S&P 500 Index after 12 and 18 months) to a certain extend. A wider yield spread is less likely to precede negative returns in the US equity market.
The second row indicates that returns in the US and UK equity markets are more likely to produce lower returns and pullback 18 months after the appearance of an inverted US yield curve.
Therefore, it is still likely that China’s stock market will keep rising regardless of the inverted US yield spread.
2. Fixed Income Market
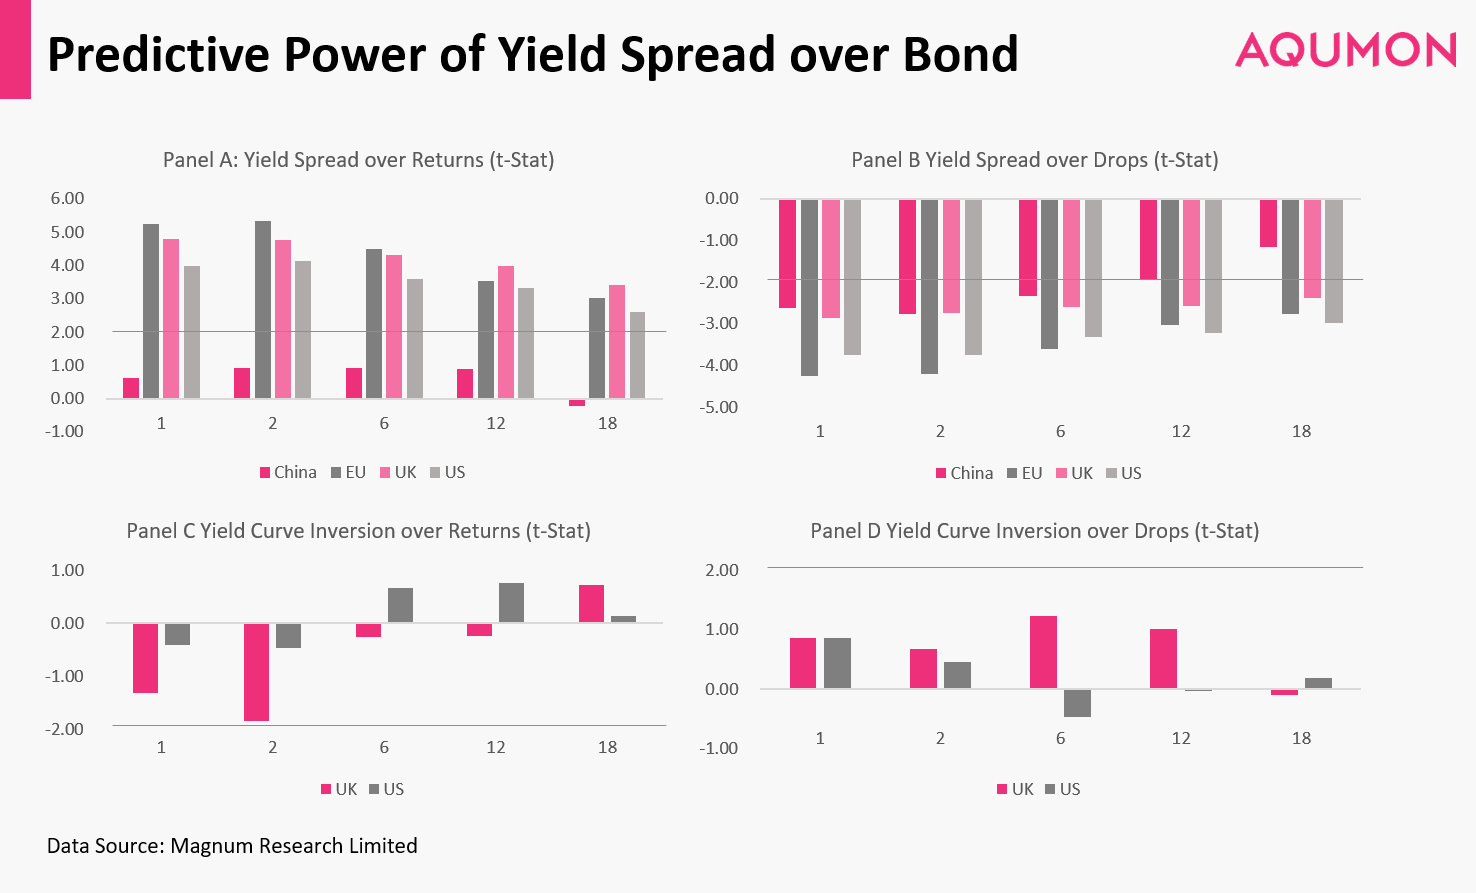
Local yield spread demonstrates a strong statistical predictive power for fixed income markets, except for predicting S&P CN Bond Index (Chinese bond market). Furthermore, the likelihood of drops in the fixed income markets in all of the economies can be predicted by the local yield spread.
These results again strongly support that smaller yield spreads tend to accompany with market drops except for the Chinese bond market whereby wider yield spreads are less likely to accompany with market drops.
On the other hand, statistically an inverted US yield curve will not likely cause the US and UK fixed income market to decline continuously.
3. Alternative Investments Market (Foreign Exchange, Gold, and Crude Oil)
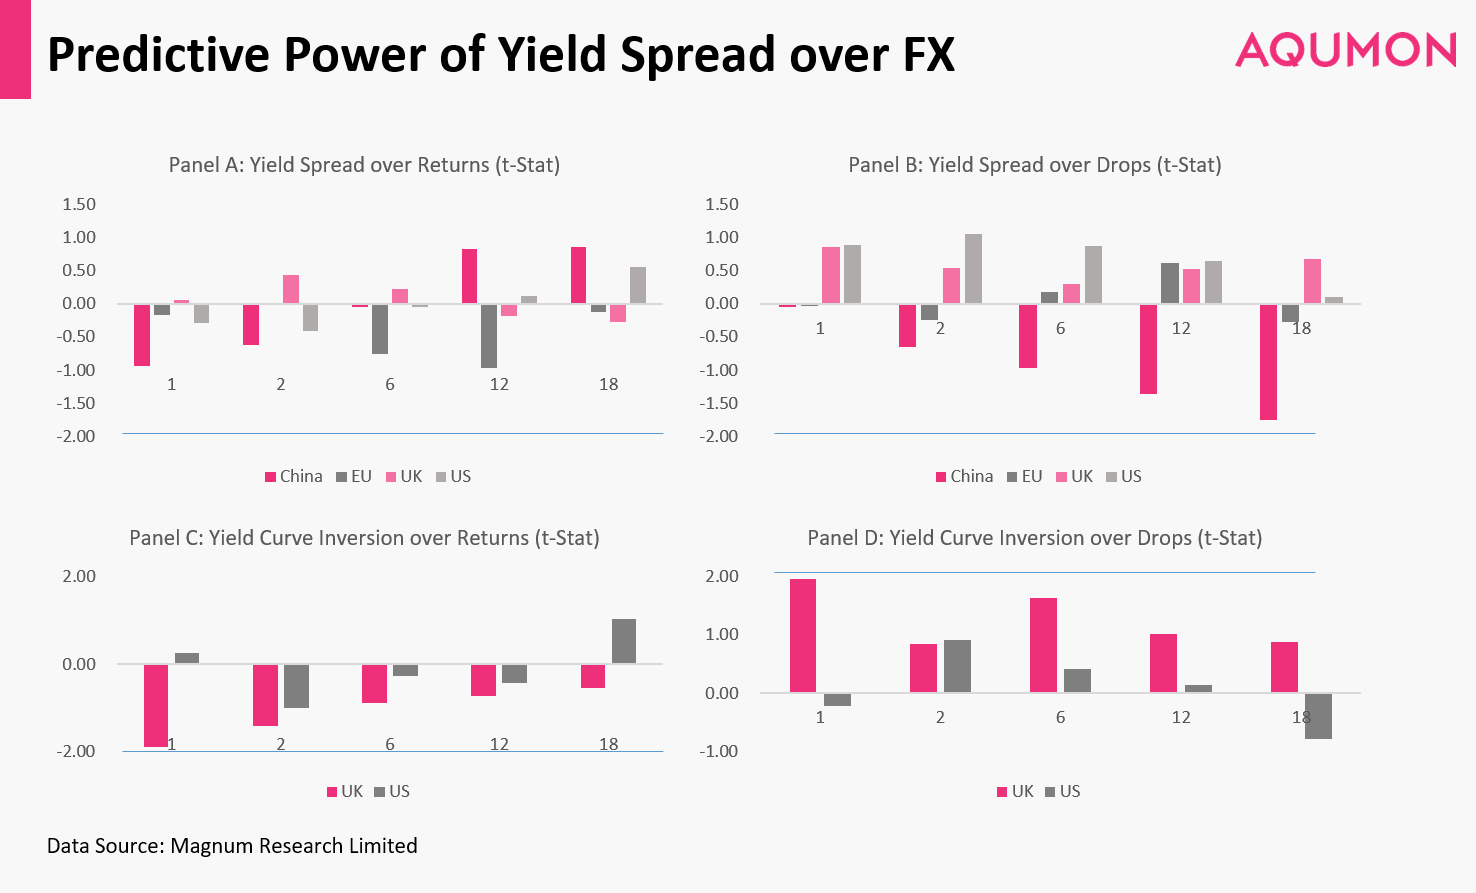
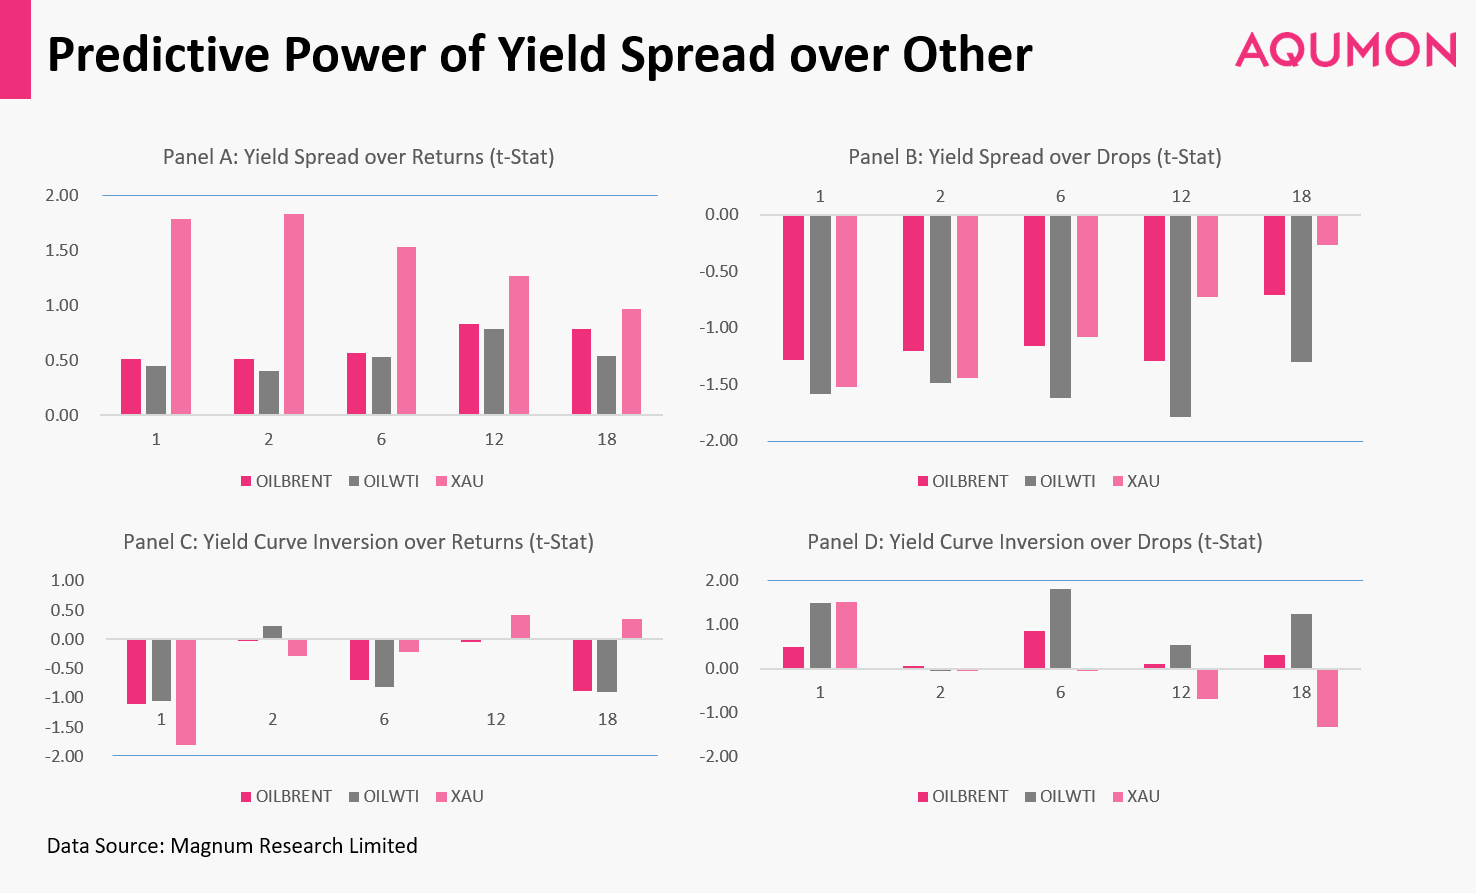
A weak association is observed between gold and the US domestic yield spread. This result is a reasonable finding because gold spot is traditionally negatively correlated with the US dollar and the US stock market, and gold is famous for being inflation protected.
Furthermore our data shows that foreign exchange and crude oil markets cannot be directly predicted by US domestic yield spread.
Is the Next Recession Coming?
Economists like Jim Glassman from J.P. Morgan argue that the reinversion may not be an ominous indicator as before.
While the two previous inversions in 2001 and 2007 were results of forceful Fed actions to control inflations for an overheating economy, the recent inversion was due to fixed market disequilibrium caused by pessimistic trade war sentiment and overseas monetary policies.
Several factors may be contributing to sliding Treasury yields; distortion from overseas monetary policy has likely pushed yields below their natural equilibrium, and bond investors may be pessimistic about trade threats that have yet to materialize.
The expansion’s fundamentals remain strong; the signal from bond markets appears more like a warning of what might happen rather than a sign of real distress.
——Jim Glassman
Moreover, after two consecutive rate cuts, the inverted US yield curve has relaxed a lot, and the yield spread between 10-year Treasury note and 1-year Treasury bill became positive again. We believe in the short term (within 2019), there is little chance for crashes in stock markets or fixed income markets.
Besides, our findings show that the inverted yield curve’s effect on such markets is limited. In contrast, events including Sino-US trade war, Brexit, and Saudi oilfield explosion have more apparent impact on market volatility.
It is difficult to predict a Black Swan Event, and investors’ efforts to predict the market based on certain potential “signals” tend to be ineffective. Therefore, we still recommend individual investors to reduce their portfolio’s investment risk through global diversification. AQUMON will keep monitoring the yield curve and other macro indicators and hope to share more findings again shortly.
Reference
AQUMON Research:The predictive power of yield spreads on financial market.
J.P. Morgan:Signals From the Yield Curve https://www.jpmorgan.com/commercial-banking/insights/signals-from-yield-curve
About us
As a leading startup in the FinTech space, AQUMON aims to make sophisticated investment advice cost-effective, transparent and accessible to both institutional and retail markets, via the adoptions of scalable technology platforms and automated investment algorithms.
AQUMON’s parent company Magnum Research Limited is licensed with Type 1 & 4 under the Securities and Futures Commission of Hong Kong. In 2017, AQUMON became the first independent Robo Advisor to be accredited by the SFC.
AQUMON’s investors include Alibaba Entrepreneurs Fund, Bank of China International and HKUST.
Disclaimer
Viewers should note that the views and opinions expressed in this material do not necessarily represent those of Magnum Research Group and its founders and employees. Magnum Research Group does not provide any representation or warranty, whether express or implied in the material, in relation to the accuracy, completeness or reliability of the information contained herein nor is it intended to be a complete statement or summary of the financial markets or developments referred to in this material. This material is presented solely for informational and educational purposes and has not been prepared with regard to the specific investment objectives, financial situation or particular needs of any specific recipient. Viewers should not construe the contents of this material as legal, tax, accounting, regulatory or other specialist of technical advice or services or investment advice or a personal recommendation. It should not be regarded by viewers as a substitute for the exercise of their own judgement. Viewers should always seek expert advice to aid decision on whether or not to use the product presented in the marketing material. This material does not constitute a solicitation, offer, or invitation to any person to invest in the intellectual property products of Magnum Research Group, nor does it constitute a solicitation, offer, or invitation to any person who resides in the jurisdiction where the local securities law prohibits such offer. Investment involves risk. The value of investments and its returns may go up and down and cannot be guaranteed. Investors may not be able to recover the original investment amount. Changes in exchange rates may also result in an increase or decrease in the value of investments. Any investment performance information presented is for demonstration purposes only and is no indication of future returns. Any opinions expressed in this material may differ or be contrary to opinions expressed by other business areas or groups of Magnum Research Limited and has not been updated. Neither Magnum Research Limited nor any of its founders, directors, officers, employees or agents accepts any liability for any loss or damage arising out of the use of all or any part of this material or reliance upon any information contained herein.