

Behind the Numbers: 3 Major US Stock Indices
Written by AQUMON Team on 2019-11-19
Summary:
We are all aware that the US stock market has three major indices (S&P 500 Index, Nasdaq Composite, Dow Jones Industrial Average). Apart from their differences in the scale of component stocks discussed in the previous article, what other differences do these indices have?
Which Index Rose the Most?
Investors who pay daily attention to these indices would easily notice that their trends tend to be very similar.
This is mainly because their component stocks are affected by the same economic cycle and other important macroeconomic factors. Thus, the indices are highly correlated.
In addition, these indices have some common component stocks, such as the technology giant Apple.
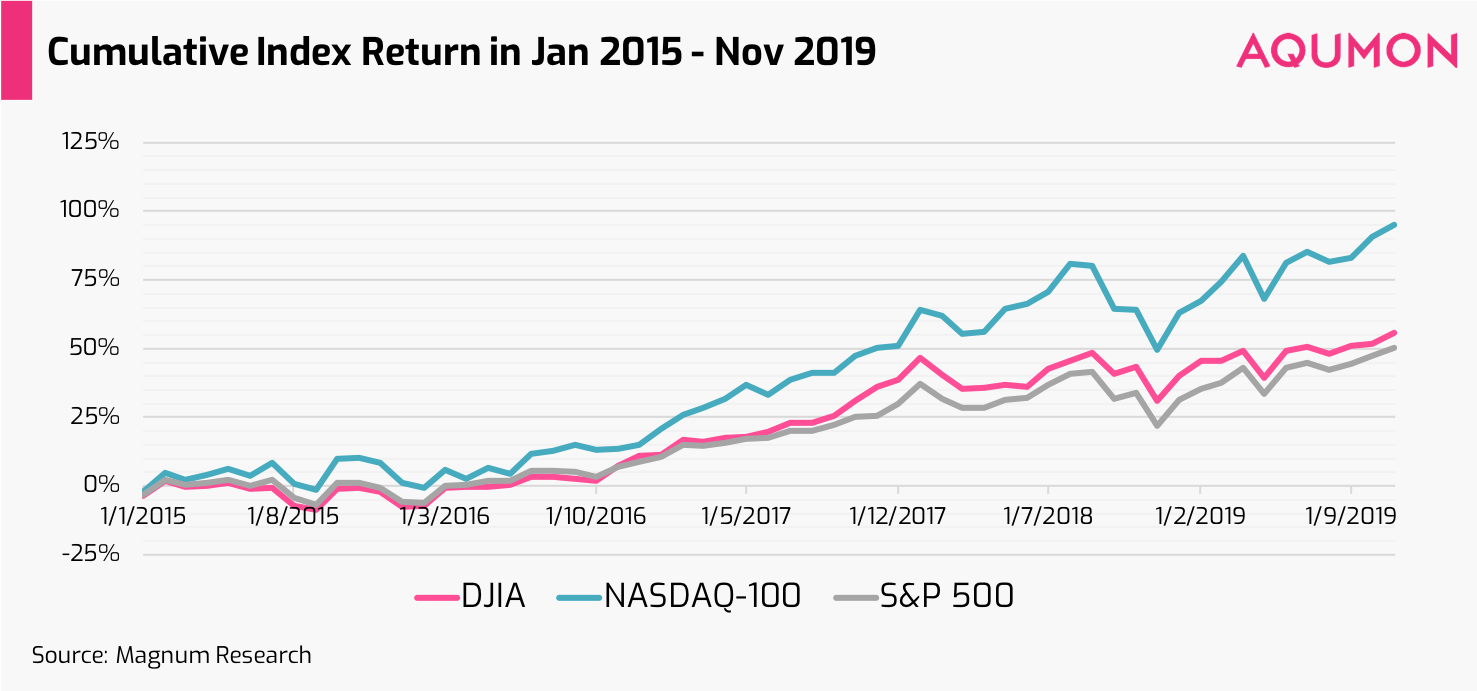
To see a more detailed comparison, we list the three indices’ performance between 2000 and 2018.
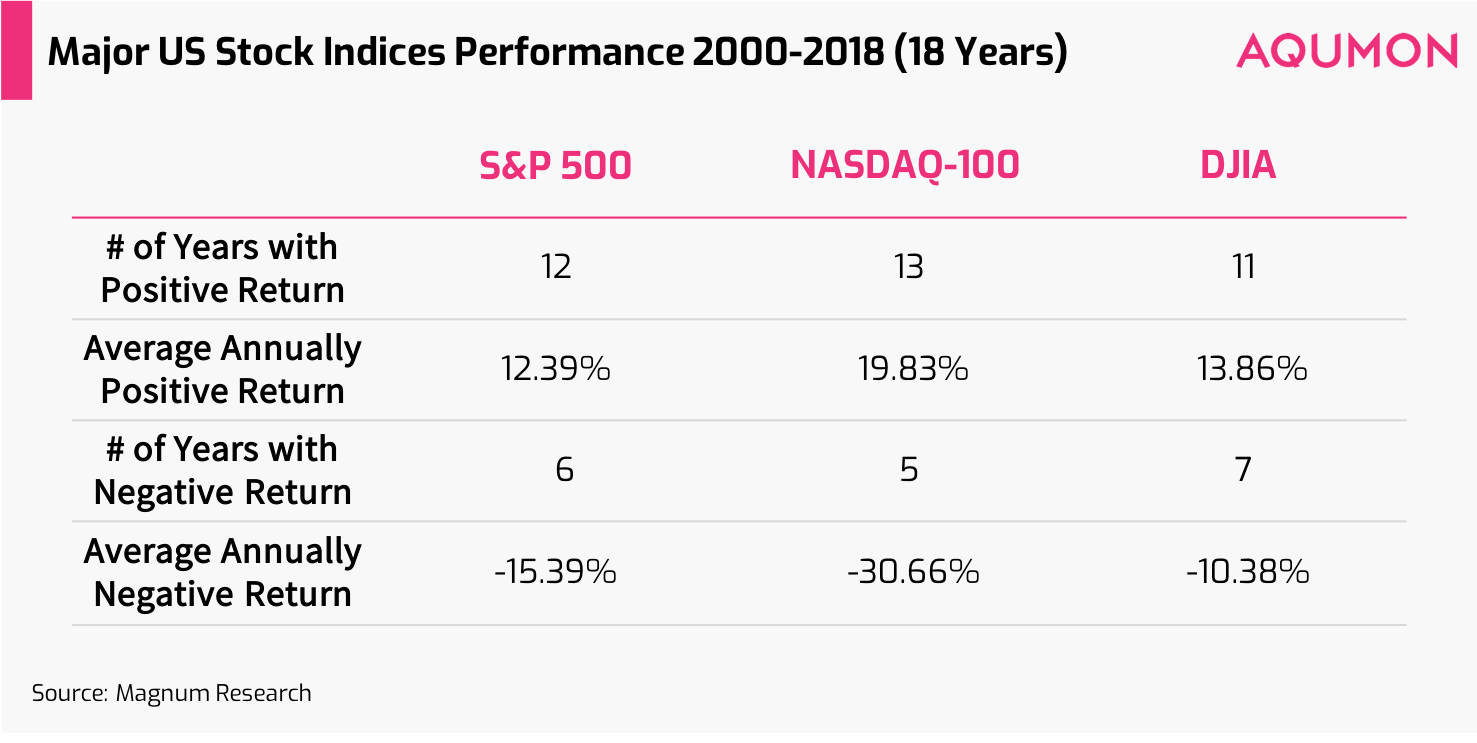
We can see that the trends of these three indices are similar but not exactly the same. Although the indices all track US stocks, they also have different characteristics.
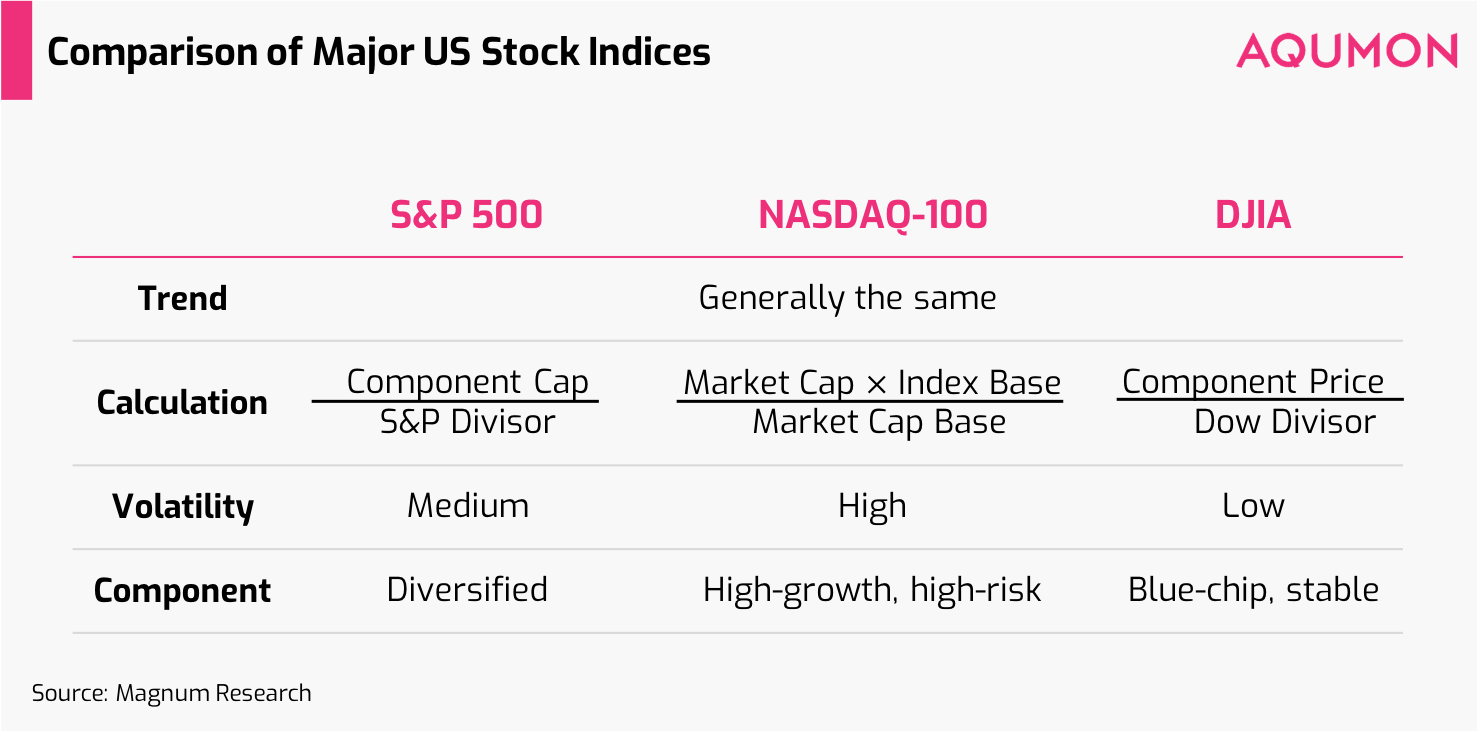
Calculation Methods and Index Characteristics
In the previous article, we briefly talked about the indices’ composition. Apart from having different component stocks, these indices are also calculated through different methods.
The S&P 500 Index is derived by dividing its component stocks’ aggregate market capitalization by the S&P divisor. The aggregate capitalization adds up to 70%-80% of the US stocks’ total market capitalization, so generally, the S&P 500 Index can reflect the entire US stock market’s trend well.
However, since the index is calculated based on stocks’ market capitalization, the top 10 component stocks would have a drastically different influence in comparison to the bottom 10 stocks.
The Dow Jones Industrial Average is derived by dividing the sum of stock prices by the Dow Divisor. Its component stocks are ranked by prices, so stocks with higher prices will have a greater impact on the index.
As the Dow’s 30 component stocks consists of mostly blue-chip stocks that best represent the US economy and commerce, changes in the stock composition can also reflect the US economy’s development track.
When the Dow was first issued in 1896, its component stocks were almost entirely heavy industrial enterprises, including coal and steel companies. In the 1980s, the Dow’s component stocks added IBM, Microsoft, and Inter, reflecting the development of IT companies. After that, the addition of companies such as Goldman Sachs and Nike further reflects the rise of financial and service industries.
Nasdaq Composite is also based on market capitalization, similar to the S&P 500 Index. But it covers the 100 largest non-financial companies listed on the Nasdaq Stock Market, including computer and telecommunication companies.
Although Nasdaq Composite has a broader stock coverage, its component stocks tend to be high growth and high risk. Therefore, it has an even more severe “top-heavy” characteristic than the S&P 500 Index. Nasdaq Composite’s top 10 component stocks aggregately weigh more than 50%, while the other 90 stocks accounts for less than half of the weight.
Volatility Difference
As the Dow only covers 30 stocks, it is more susceptible to changes in a single stock. However, the Dow’s volatility is the lowest among the three, because its component stocks are mainly well-performing blue-chip companies whose volatility is generally low. On the other hand, if one of the companies’ stock drops significantly due to negative events, the index will be dragged down.
For instance, when Boeing's stock price, one of Dow's component stocks, significantly decreased in March due to a plane clash accident, the index fell 96.22 points (0.38%) at the same day.
Although Nasdaq Composite is the youngest index of the three, it has been widely popular since inception. In 1999, the Nasdaq Stock Market exceeded the New York Stock Exchange in terms of company listings.
As mentioned above, Nasdaq Composite’s top 10 component stocks are over-represented, and the index is more susceptible to these stocks. Therefore, Nasdaq Composite’s volatility is the highest among the three, as its component stocks are mainly high-risk, high-growth technology companies like Facebook, Google, and Amazon.
Since the S&P 500 Index has extensive coverage of 500 component stocks, it is often used to represent the market factor. Its volatility is generally between that of the Dow and Nasdaq Composite.
About us
As a leading startup in the FinTech space, AQUMON aims to make sophisticated investment advice cost-effective, transparent and accessible to both institutional and retail markets, via the adoptions of scalable technology platforms and automated investment algorithms.
AQUMON’s parent company Magnum Research Limited is licensed with Type 1 & 4 under the Securities and Futures Commission of Hong Kong. In 2017, AQUMON became the first independent Robo Advisor to be accredited by the SFC.
AQUMON’s investors include Alibaba Entrepreneurs Fund, Bank of China International and HKUST.
Disclaimer
Viewers should note that the views and opinions expressed in this material do not necessarily represent those of Magnum Research Group and its founders and employees. Magnum Research Group does not provide any representation or warranty, whether express or implied in the material, in relation to the accuracy, completeness or reliability of the information contained herein nor is it intended to be a complete statement or summary of the financial markets or developments referred to in this material. This material is presented solely for informational and educational purposes and has not been prepared with regard to the specific investment objectives, financial situation or particular needs of any specific recipient. Viewers should not construe the contents of this material as legal, tax, accounting, regulatory or other specialist of technical advice or services or investment advice or a personal recommendation. It should not be regarded by viewers as a substitute for the exercise of their own judgement. Viewers should always seek expert advice to aid decision on whether or not to use the product presented in the marketing material. This material does not constitute a solicitation, offer, or invitation to any person to invest in the intellectual property products of Magnum Research Group, nor does it constitute a solicitation, offer, or invitation to any person who resides in the jurisdiction where the local securities law prohibits such offer. Investment involves risk. The value of investments and its returns may go up and down and cannot be guaranteed. Investors may not be able to recover the original investment amount. Changes in exchange rates may also result in an increase or decrease in the value of investments. Any investment performance information presented is for demonstration purposes only and is no indication of future returns. Any opinions expressed in this material may differ or be contrary to opinions expressed by other business areas or groups of Magnum Research Limited and has not been updated. Neither Magnum Research Limited nor any of its founders, directors, officers, employees or agents accepts any liability for any loss or damage arising out of the use of all or any part of this material or reliance upon any information contained herein.