

HK Stock Portfolios Rebalancing Notes
Written by AQUMON Team on 2021-08-23
This is a routine quarterly rebalancing.
AQUMON SmartStocks® Thematic Stock Portfolios aggregates a selection of investment themes based on the characteristics of the Hong Kong stock market, with a combination of factor-rating methods to improve strategic performance, providing customers with high-yield, low-risk investment portfolios. With the recent disclosures in the companies’ interim reports and changes in the market regulatory environment, a rebalancing of the portfolios is required to cope with rapidly changing market trends.
How Has the Investment Strategy Improved?
In this rebalancing, the Hong Kong stock portfolio strategy has been improved to make it more suitable for current market conditions. The specific changes are as follows:
1. An uplift to our factor-rating mechanism
We have made different adjustments to different stock portfolios.
Chinese Tech Stars: The factors for screening stocks have been modified. Current factors include: market value, operating income growth rate, gross profit, return on total assets, rate of collection of accounts receivable, stability of operating profit, and leverage ratio. Compared with the previous version, we have newly added operating profit stability in order to select high-quality companies with stable performance.
HK Market Leaders: The factors for screening stocks have been modified. Current factors include: market capitalization, return on net assets, return on total assets, operating profit, and leverage. Compared with the previous version, we have newly added a return on net assets to further ensure the profitability of leading companies in the industry.
High Dividends: The factors for screening stocks have been modified. Current factors include: market value, return on net assets, operating profit, operating cash flow, cash profit rate, operating income growth rate, dividend rate. Compared with the previous version, we replaced the return on total assets with the return on net assets, and added three new factors: market value, operating income growth rate, and cash profit margin. We believe that only high-quality companies with strong profitability, stable growth, sufficient cash reserves, and a tradition of dividend distribution, will have higher dividend yields in the future.
Property Moguls: The factor for screening stocks has been modified. Current factors include: market value, return on net assets, return on total assets, cash profit margin, operating income growth rate, price-earnings ratio, dividend rate. Compared with the previous version, we have newly added market value, return on net assets, and cash profit margin to ensure that the selected stocks are truly outstanding real estate stocks.
2. Industry-neutral weighting allocation
Based on Smart Beta's product positioning, we hope that performance of the product can align with that of the benchmark’s but with a certain level of excess return. Therefore, in this rebalancing, the industry exposure of the HK Stock Portfolios (Chinese Tech Stars, HK Market Leaders, High Dividends, Property Moguls) has been adjusted according to the compositions of the relevant benchmark to enhance the level of synchronization between the portfolio and the benchmark, and reduce the portfolio specific risk. Among them, the Property Moguls adopt market value and factor rating weightings.
3. More in-depth research on fundamentals and industry research reports
SmartStock portfolios are generated automatically through our intelligent recommendation system. We would then conduct a detailed analysis of the fundamentals, industry research reports, and public opinion of the underlying stocks with an aim to replace those stocks with poor fundamental performance and negative news. For example, for stocks with better performance such as Perfect Medical (1830.HK), we found that they have implemented prepayment schemes for their treatments to support business expansion. In the meantime, they were also exposed to business risks such as entrusted agency problems of the management team and violations of consumer rights, so we removed the stock from the portfolio. Another example demonstrating our ability to avoid similar stocks within the same portfolio: Xinyi Solar (968.HK) and Xinyi Glass (868.HK) were both selected for HK Market Leaders, so we made adjustments accordingly to reduce the correlation of the underlying stocks.
4. Tighter upper and lower bounds for a single position
We have set tighter stock screening specifications with more reasonable monitoring criteria for different strategies.
The latest recommended portfolio
1. Chinese Tech Stars
In terms of portfolio construction, the Chinese Tech Stars retains Alibaba Health, CSPC, Sany International, Sunny Optical Technology, AAC Technology, Meituan Dianping-W, Shanghai Fudan, SMIC, Kingdee International, Lenovo Group , Xiaomi Group-W, Tencent Holdings, Hua Hong Semiconductor, BYD Electronics, ZhongAn Online, GAC Group, Anta Sports, Li Ning, removed some under-performing small market capitalization companies, and added 12 new companies including WuXi Biologics and Sinopharm Leading technology and medical enterprises.
2. HK Market Leaders
In terms of portfolio construction, the HK Market Leaders retains Tencent Holdings, Shenzhou International, Conch Cement, China Petroleum, China Shenhua, China Mobile, China Telecom, and 22 new ones including HKEX, Anta Sports, and Hansen Pharmaceuticals. Leading enterprises in the industry. The main reasons for the major changes in the constituent stocks after this rebalance are the improvement of the combination strategy method and the difference in the financial performance of various companies in the interim report, which is quite different from the previous period's factor score ranking.
3. High Dividends
In terms of portfolio construction, the High Dividends retains IGG, China Mobile, Want Want China, and Dali Foods, and 26 leading companies including Postal Savings Bank of China, Li Ning and Sinopharm Holdings have been added. The main reasons for the major changes in the constituent stocks after this rebalance are the improvement of the combination strategy method and the difference in the financial performance of various companies in the interim report, which is quite different from the previous period's factor score ranking.
4. Property Moguls
In terms of portfolio construction, the constituents of Property Moguls have not changed. They are Chunquan REIT, China Merchants Commercial Realty, Regal REIT, Champion REIT, Yuexiu REIT, Sunshine Real Estate Fund, and Fortune are still retained. Real Estate Trust, China Tower, Prosperity REIT, and Link Real Estate Fund with slight changes in their weights.
Strategy backtested results
The YTD performance of each portfolio in the past six months after the rebalancing is as follows:
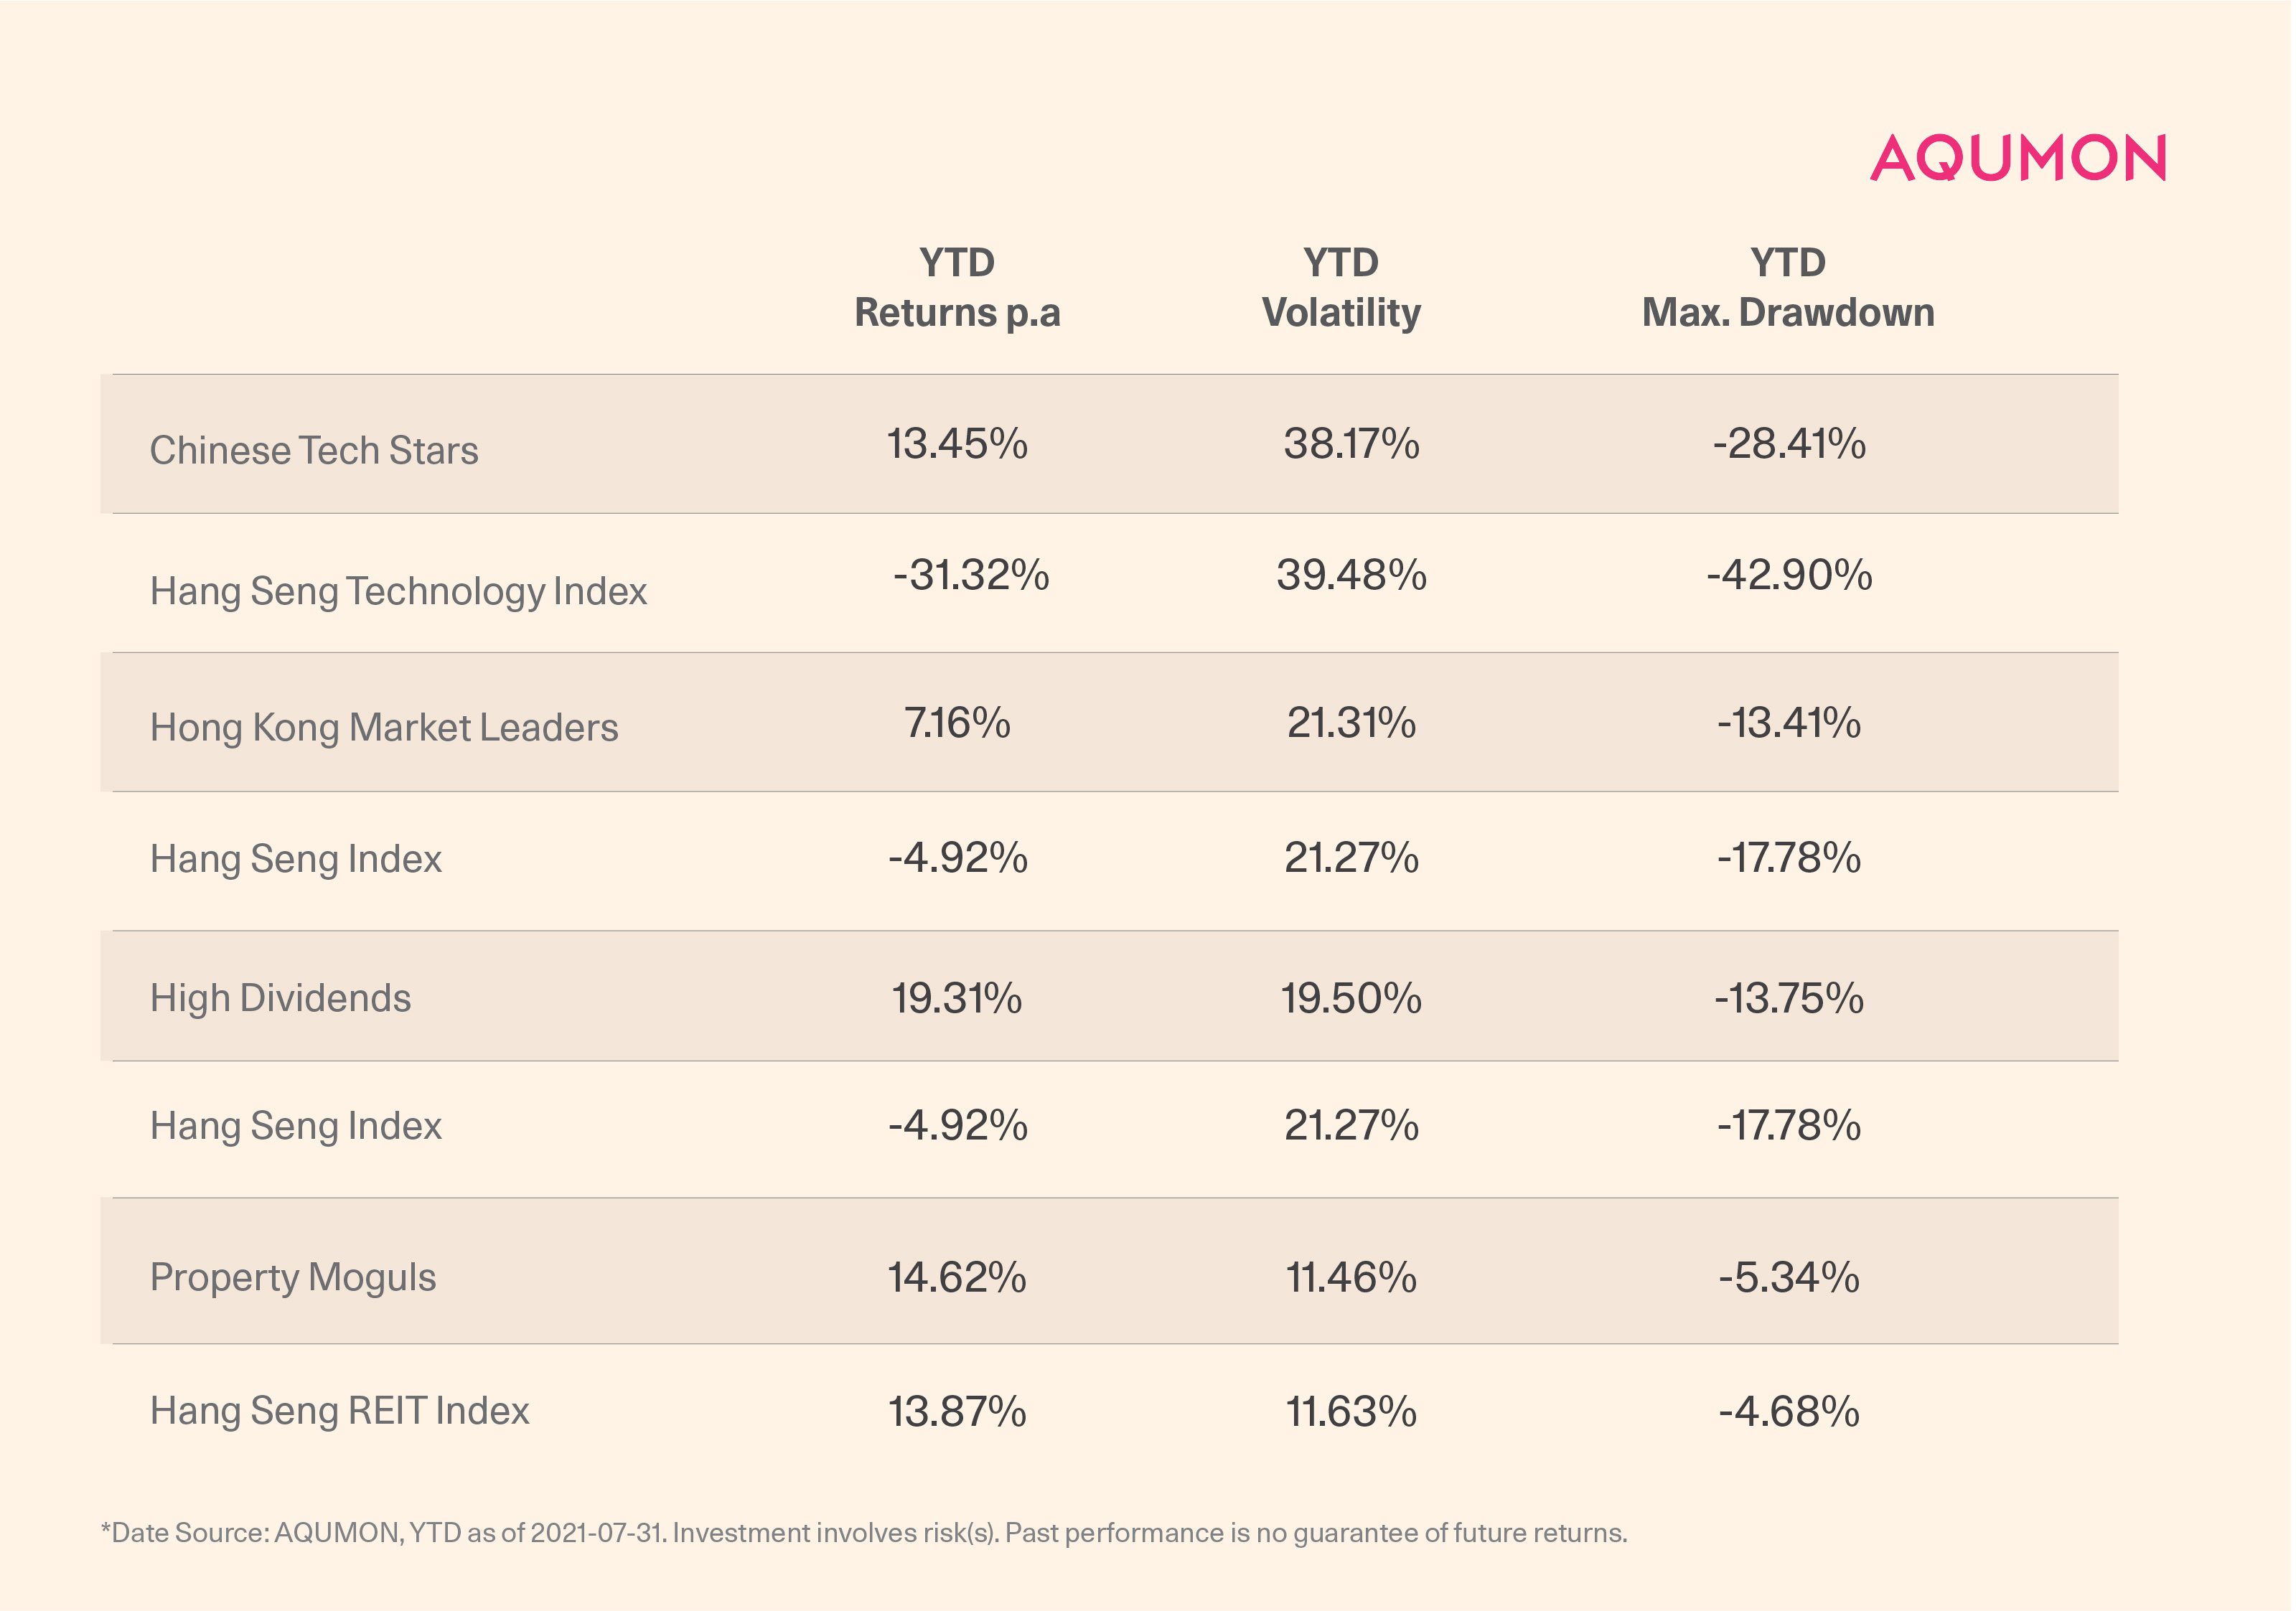
*Note: The rows in white color is the benchmark corresponding to the stock portfolio above. The benchmark for Hong Kong Market Leaders and High Dividends is the Hang Seng Total Return Index
According to the performance of YTD in the past six months, the return of our Chinese Tech Stars portfolio exceeded the benchmark Hang Seng Technology Index by 44.77%, the Hong Kong Market Leaders portfolio exceeded the benchmark Hang Seng Index by 12.08%, the High Dividends exceeded the benchmark Hang Seng Index by 24.23%, and the Property Moguls portfolio exceeds the benchmark Hang Seng Index by 0.75%, and at the same time, the benchmark volatility of our four portfolios are basically the same. On the whole, the Sharpe Ratio and Calmar Ratio of the four portfolios after the Hong Kong stock adjustment is much higher than the benchmark, which shows that our portfolio has achieved higher returns and performed better when the risk is equal to the benchmark.
1. Backtested performance of the Chinese Tech Stars
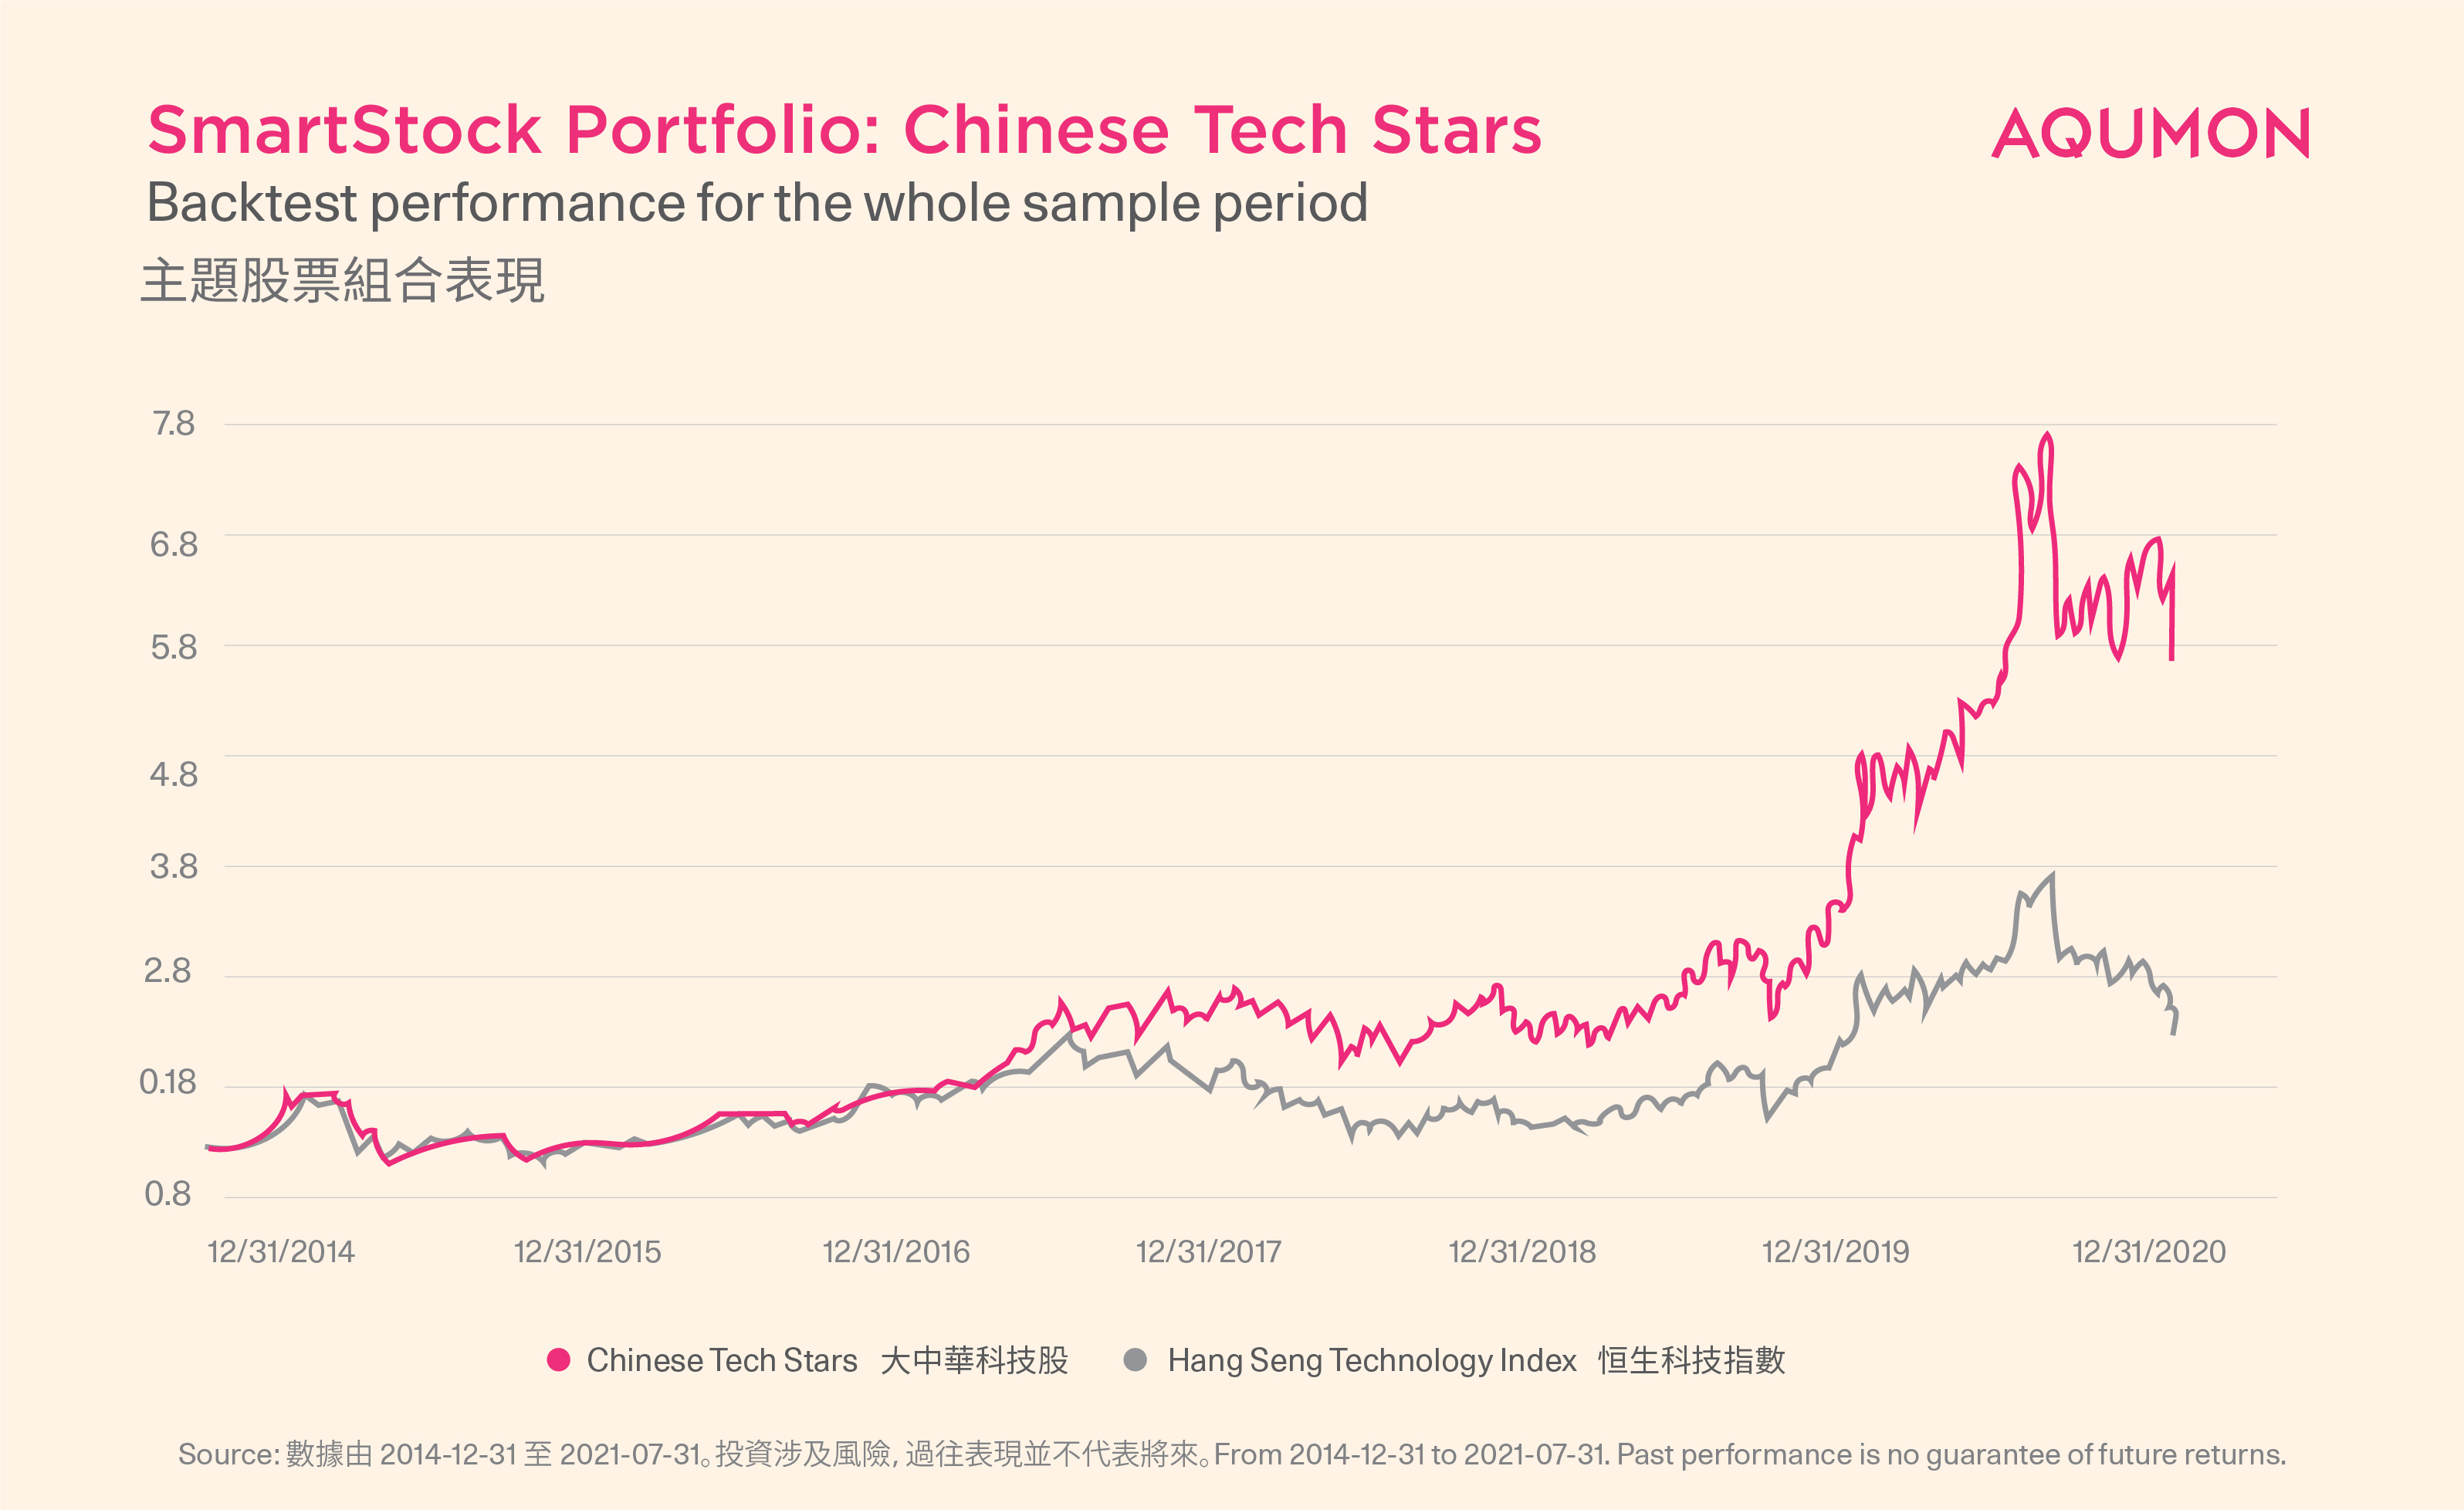
The annualized return in the past five years is 40.32%, exceeding the benchmark Hang Seng Technology Index by 25.21%, and the maximum drawdown of the portfolio is less than the benchmark;
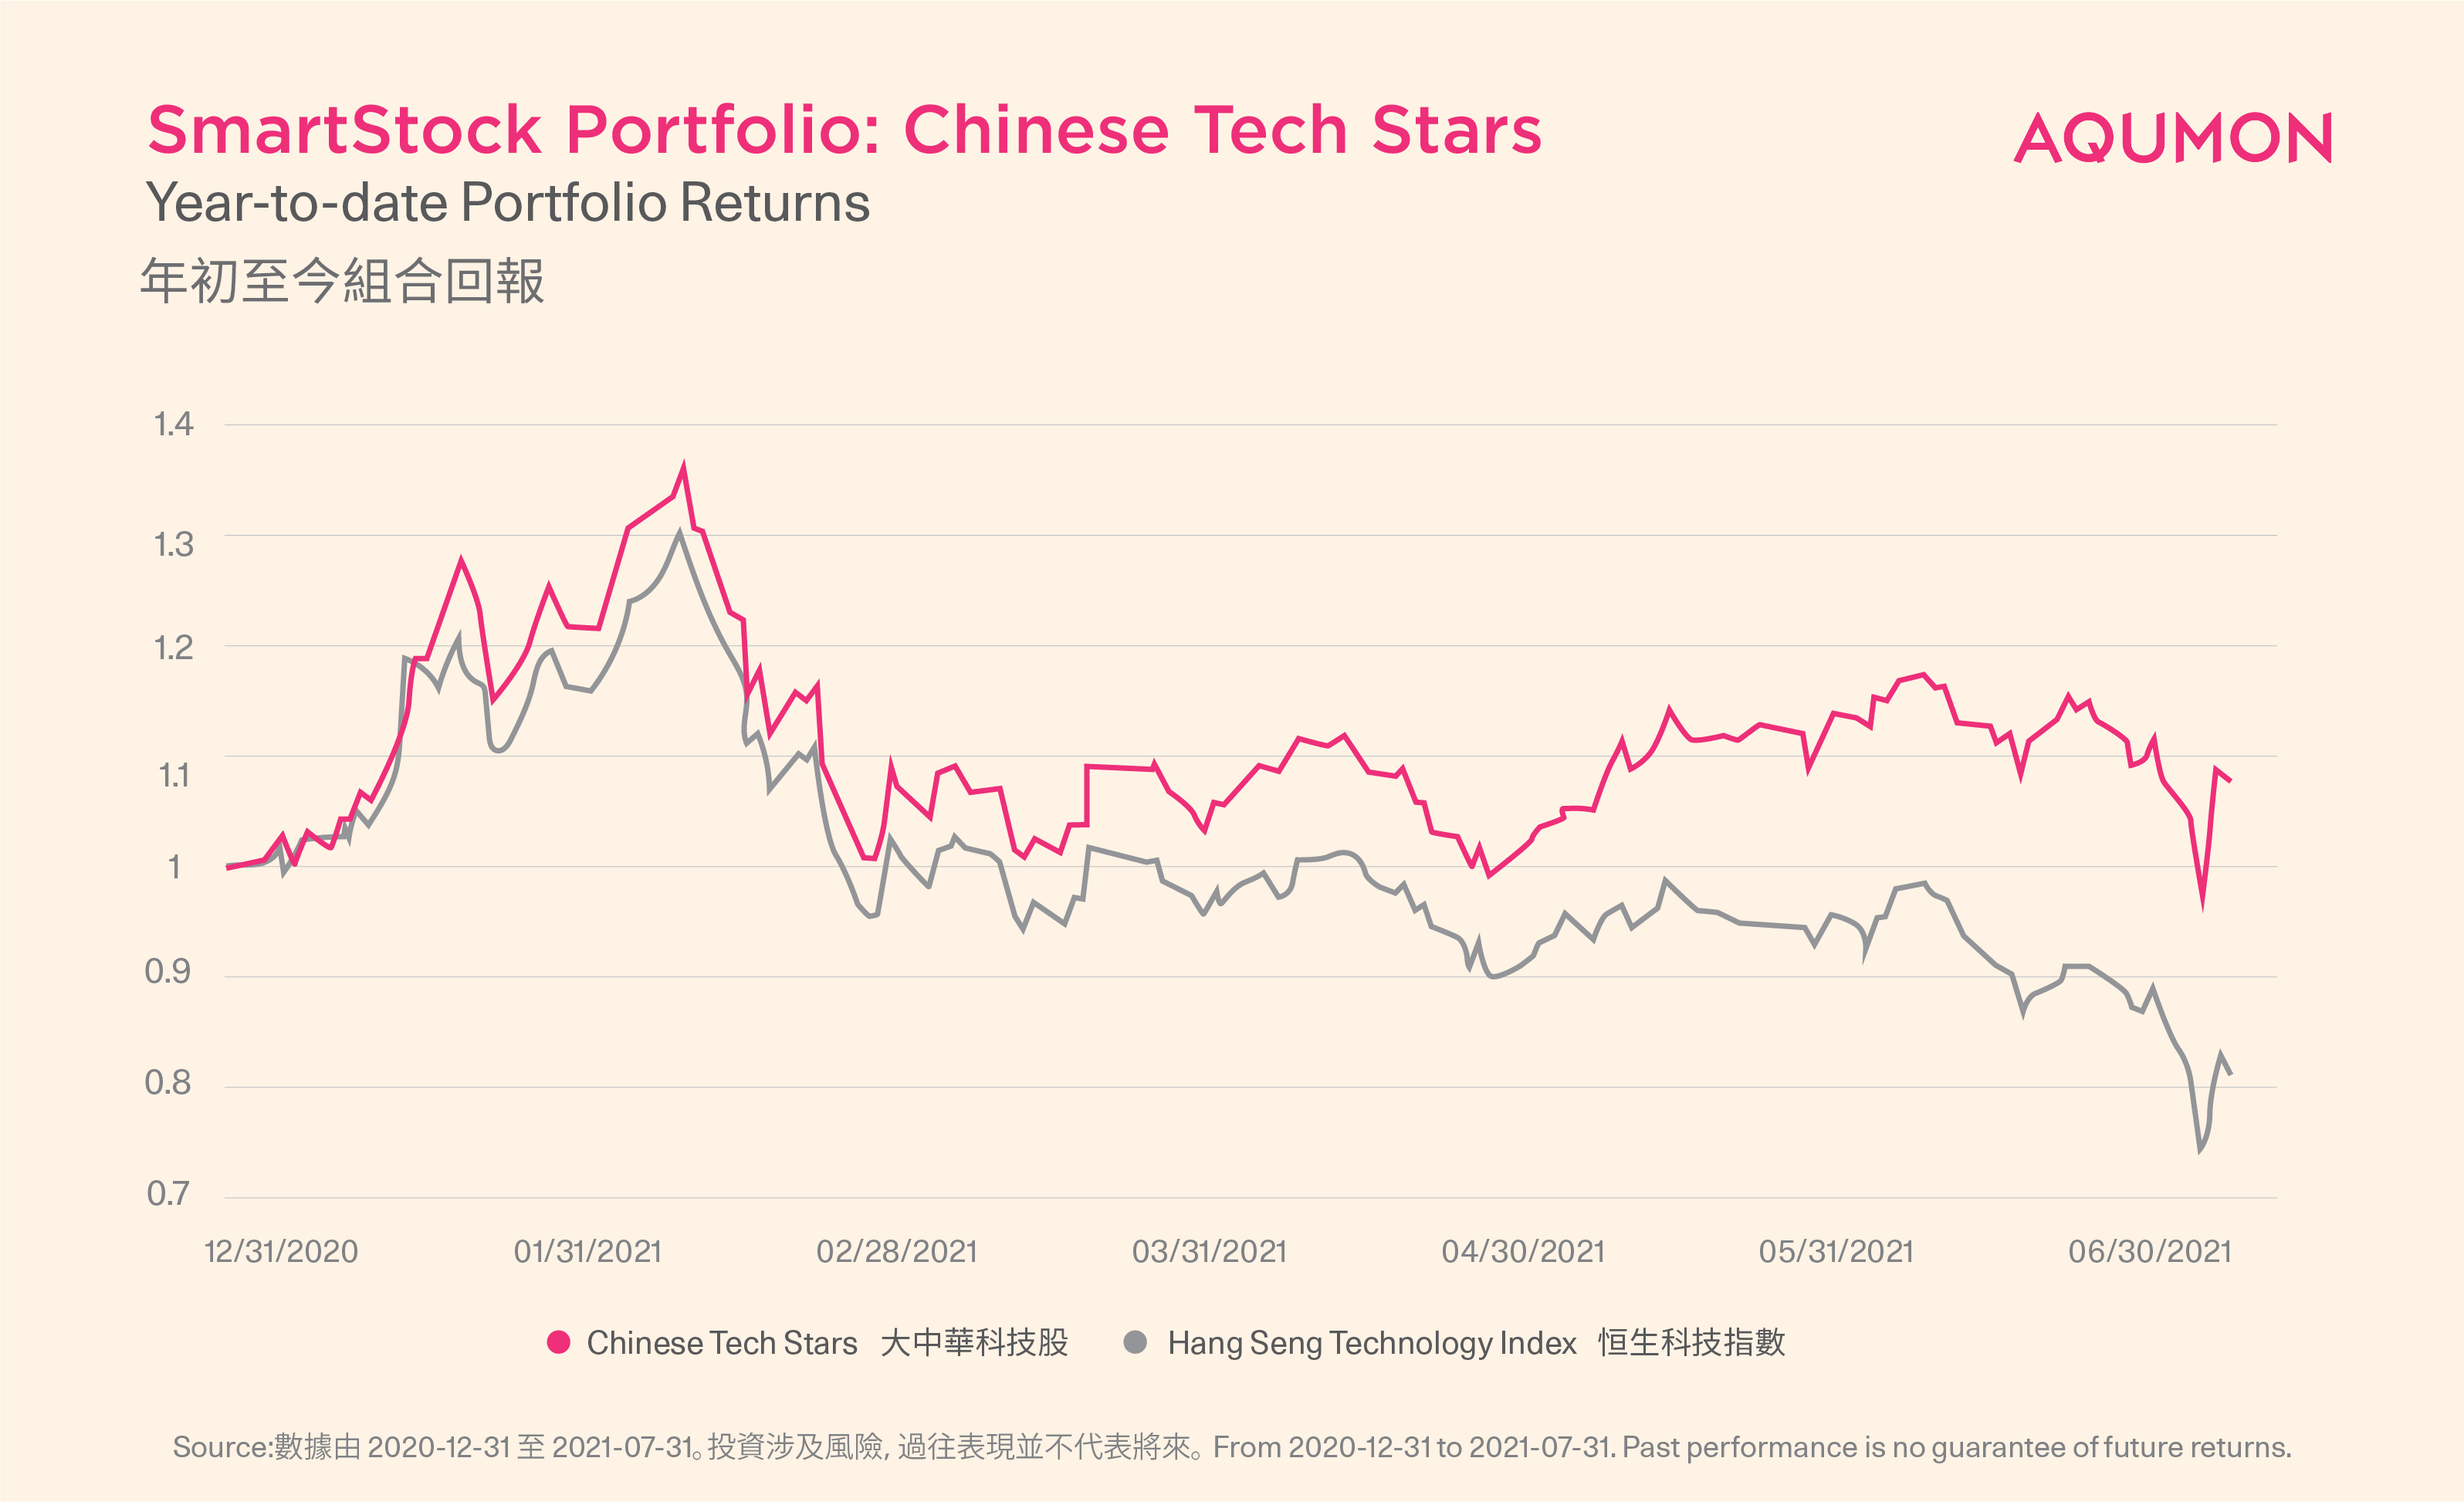
Since the beginning of this year, the total return of the portfolio has risen by 7.57%, while the benchmark Hang Seng Technology Index has fallen by 19.52%. The maximum drawdown of the portfolio is still smaller than the benchmark.
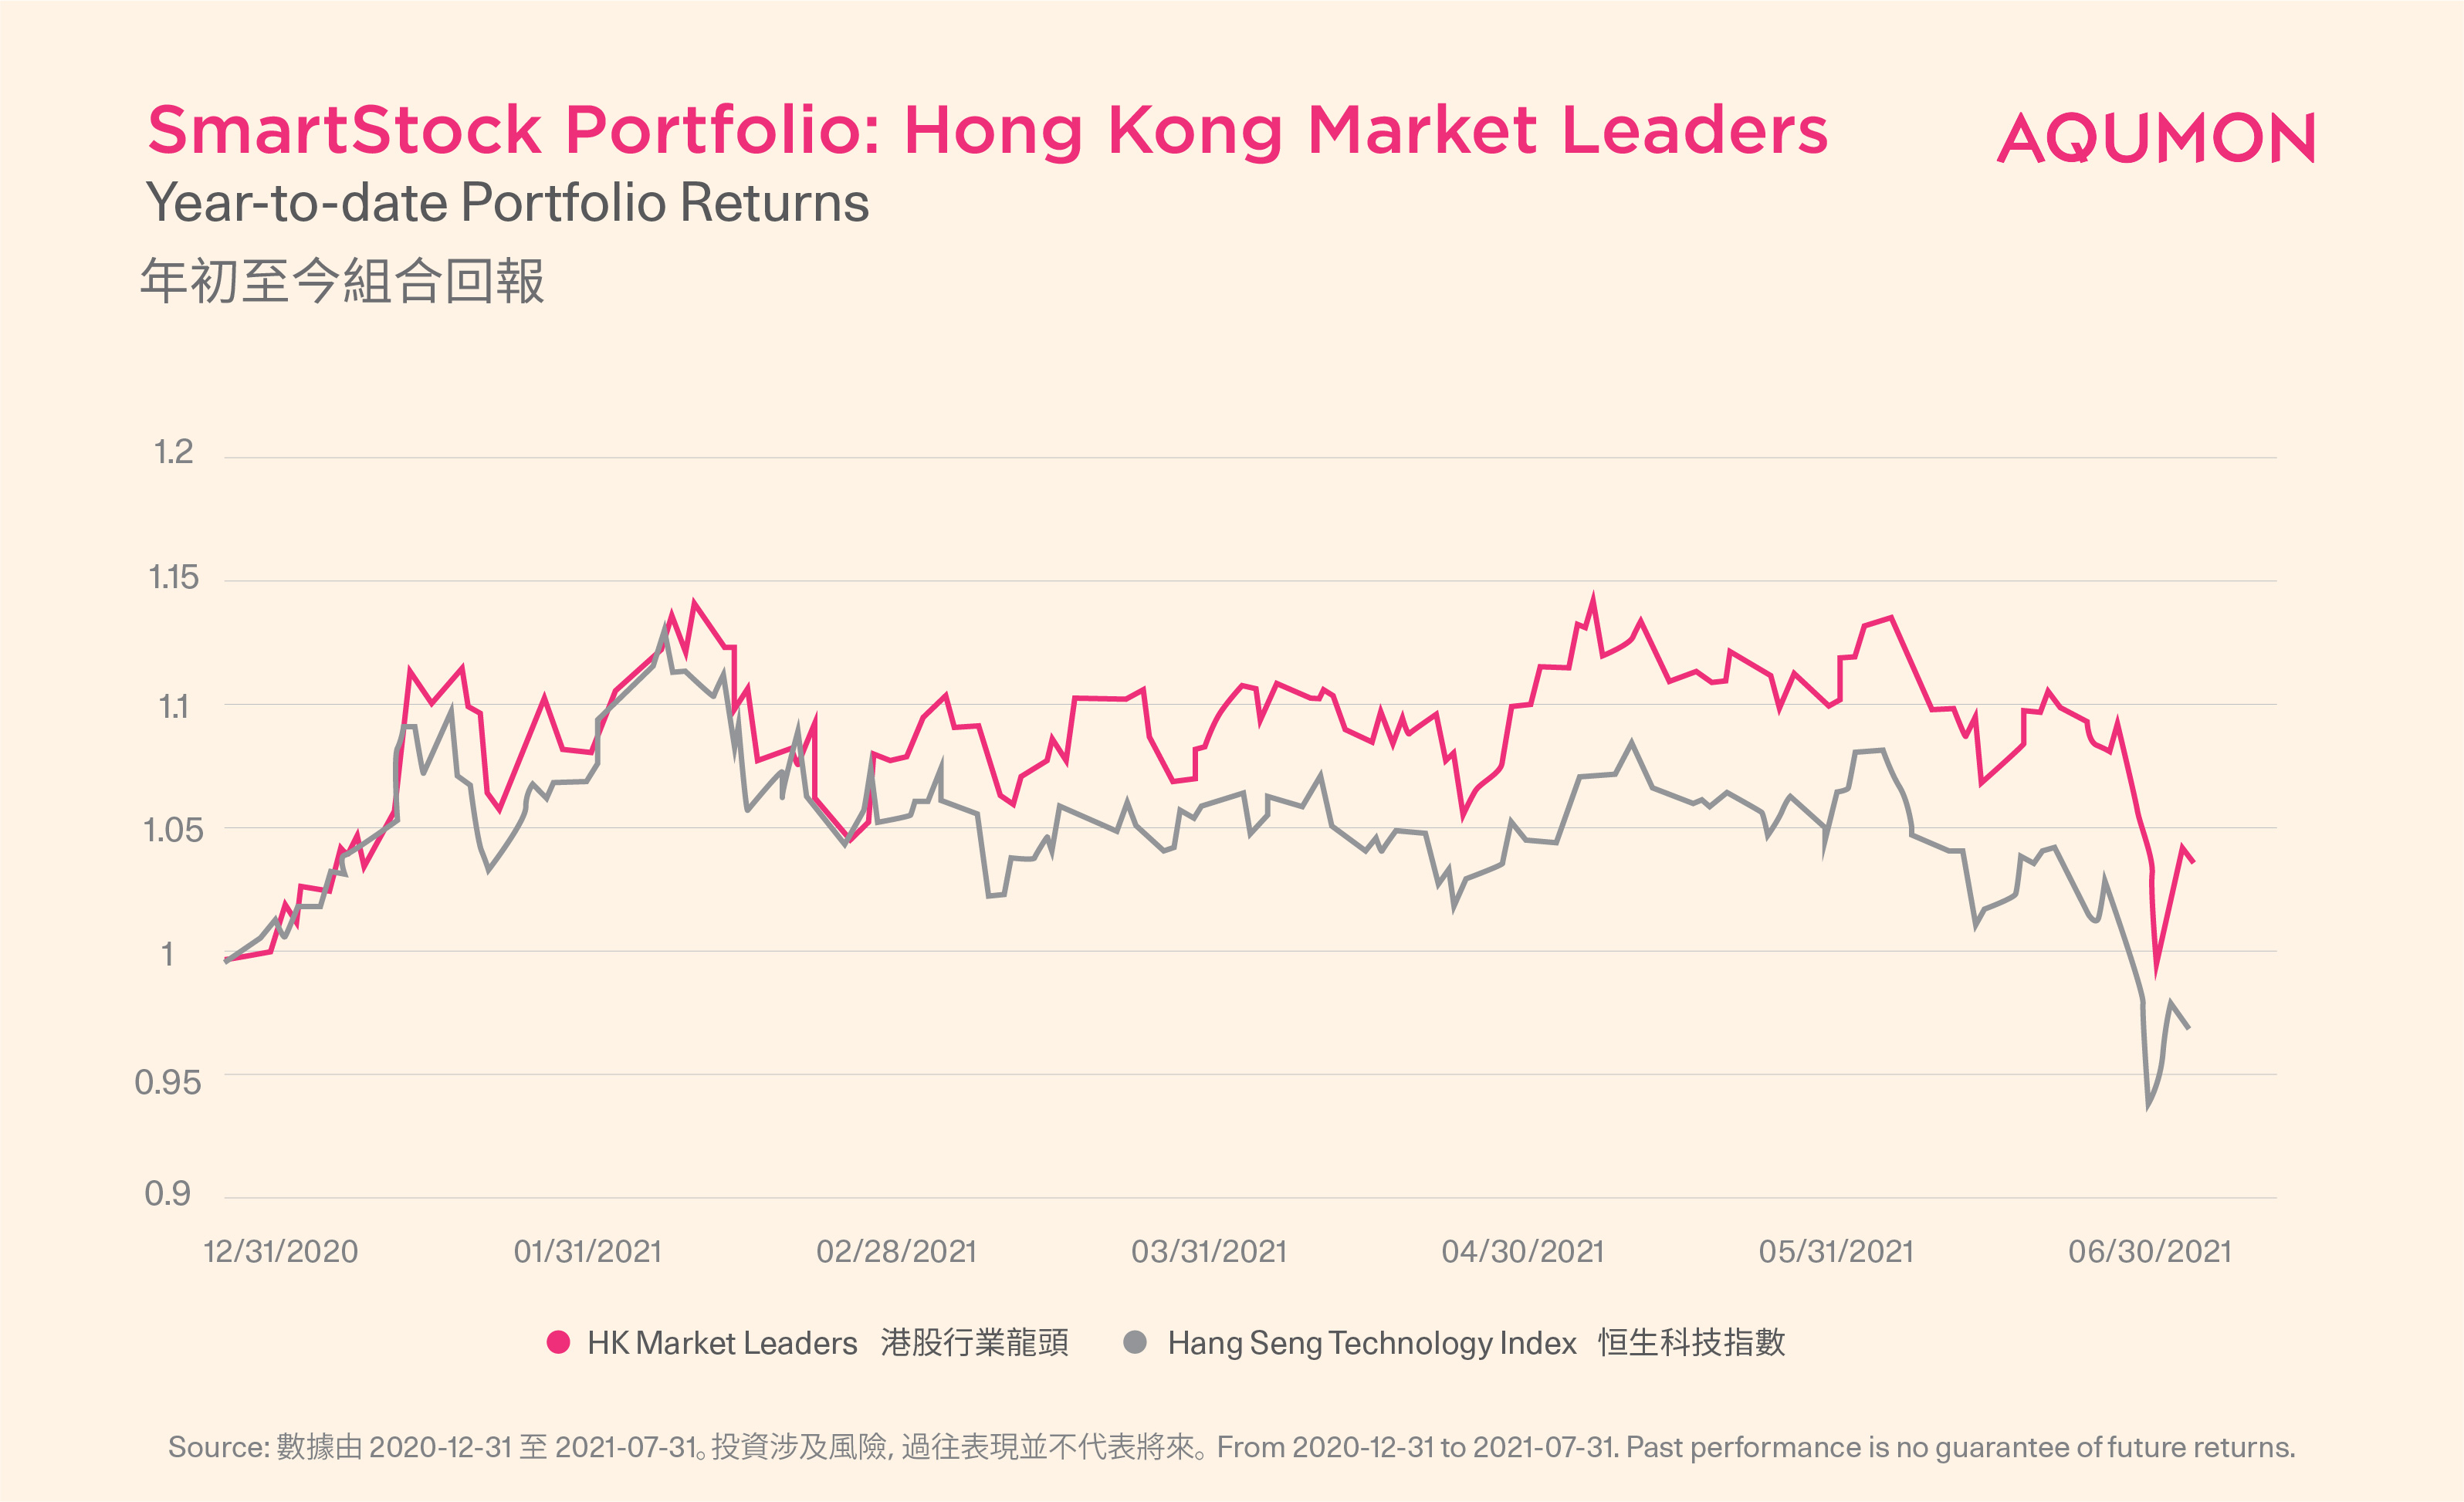
2. Backtested performance of the H.K. Market Leaders
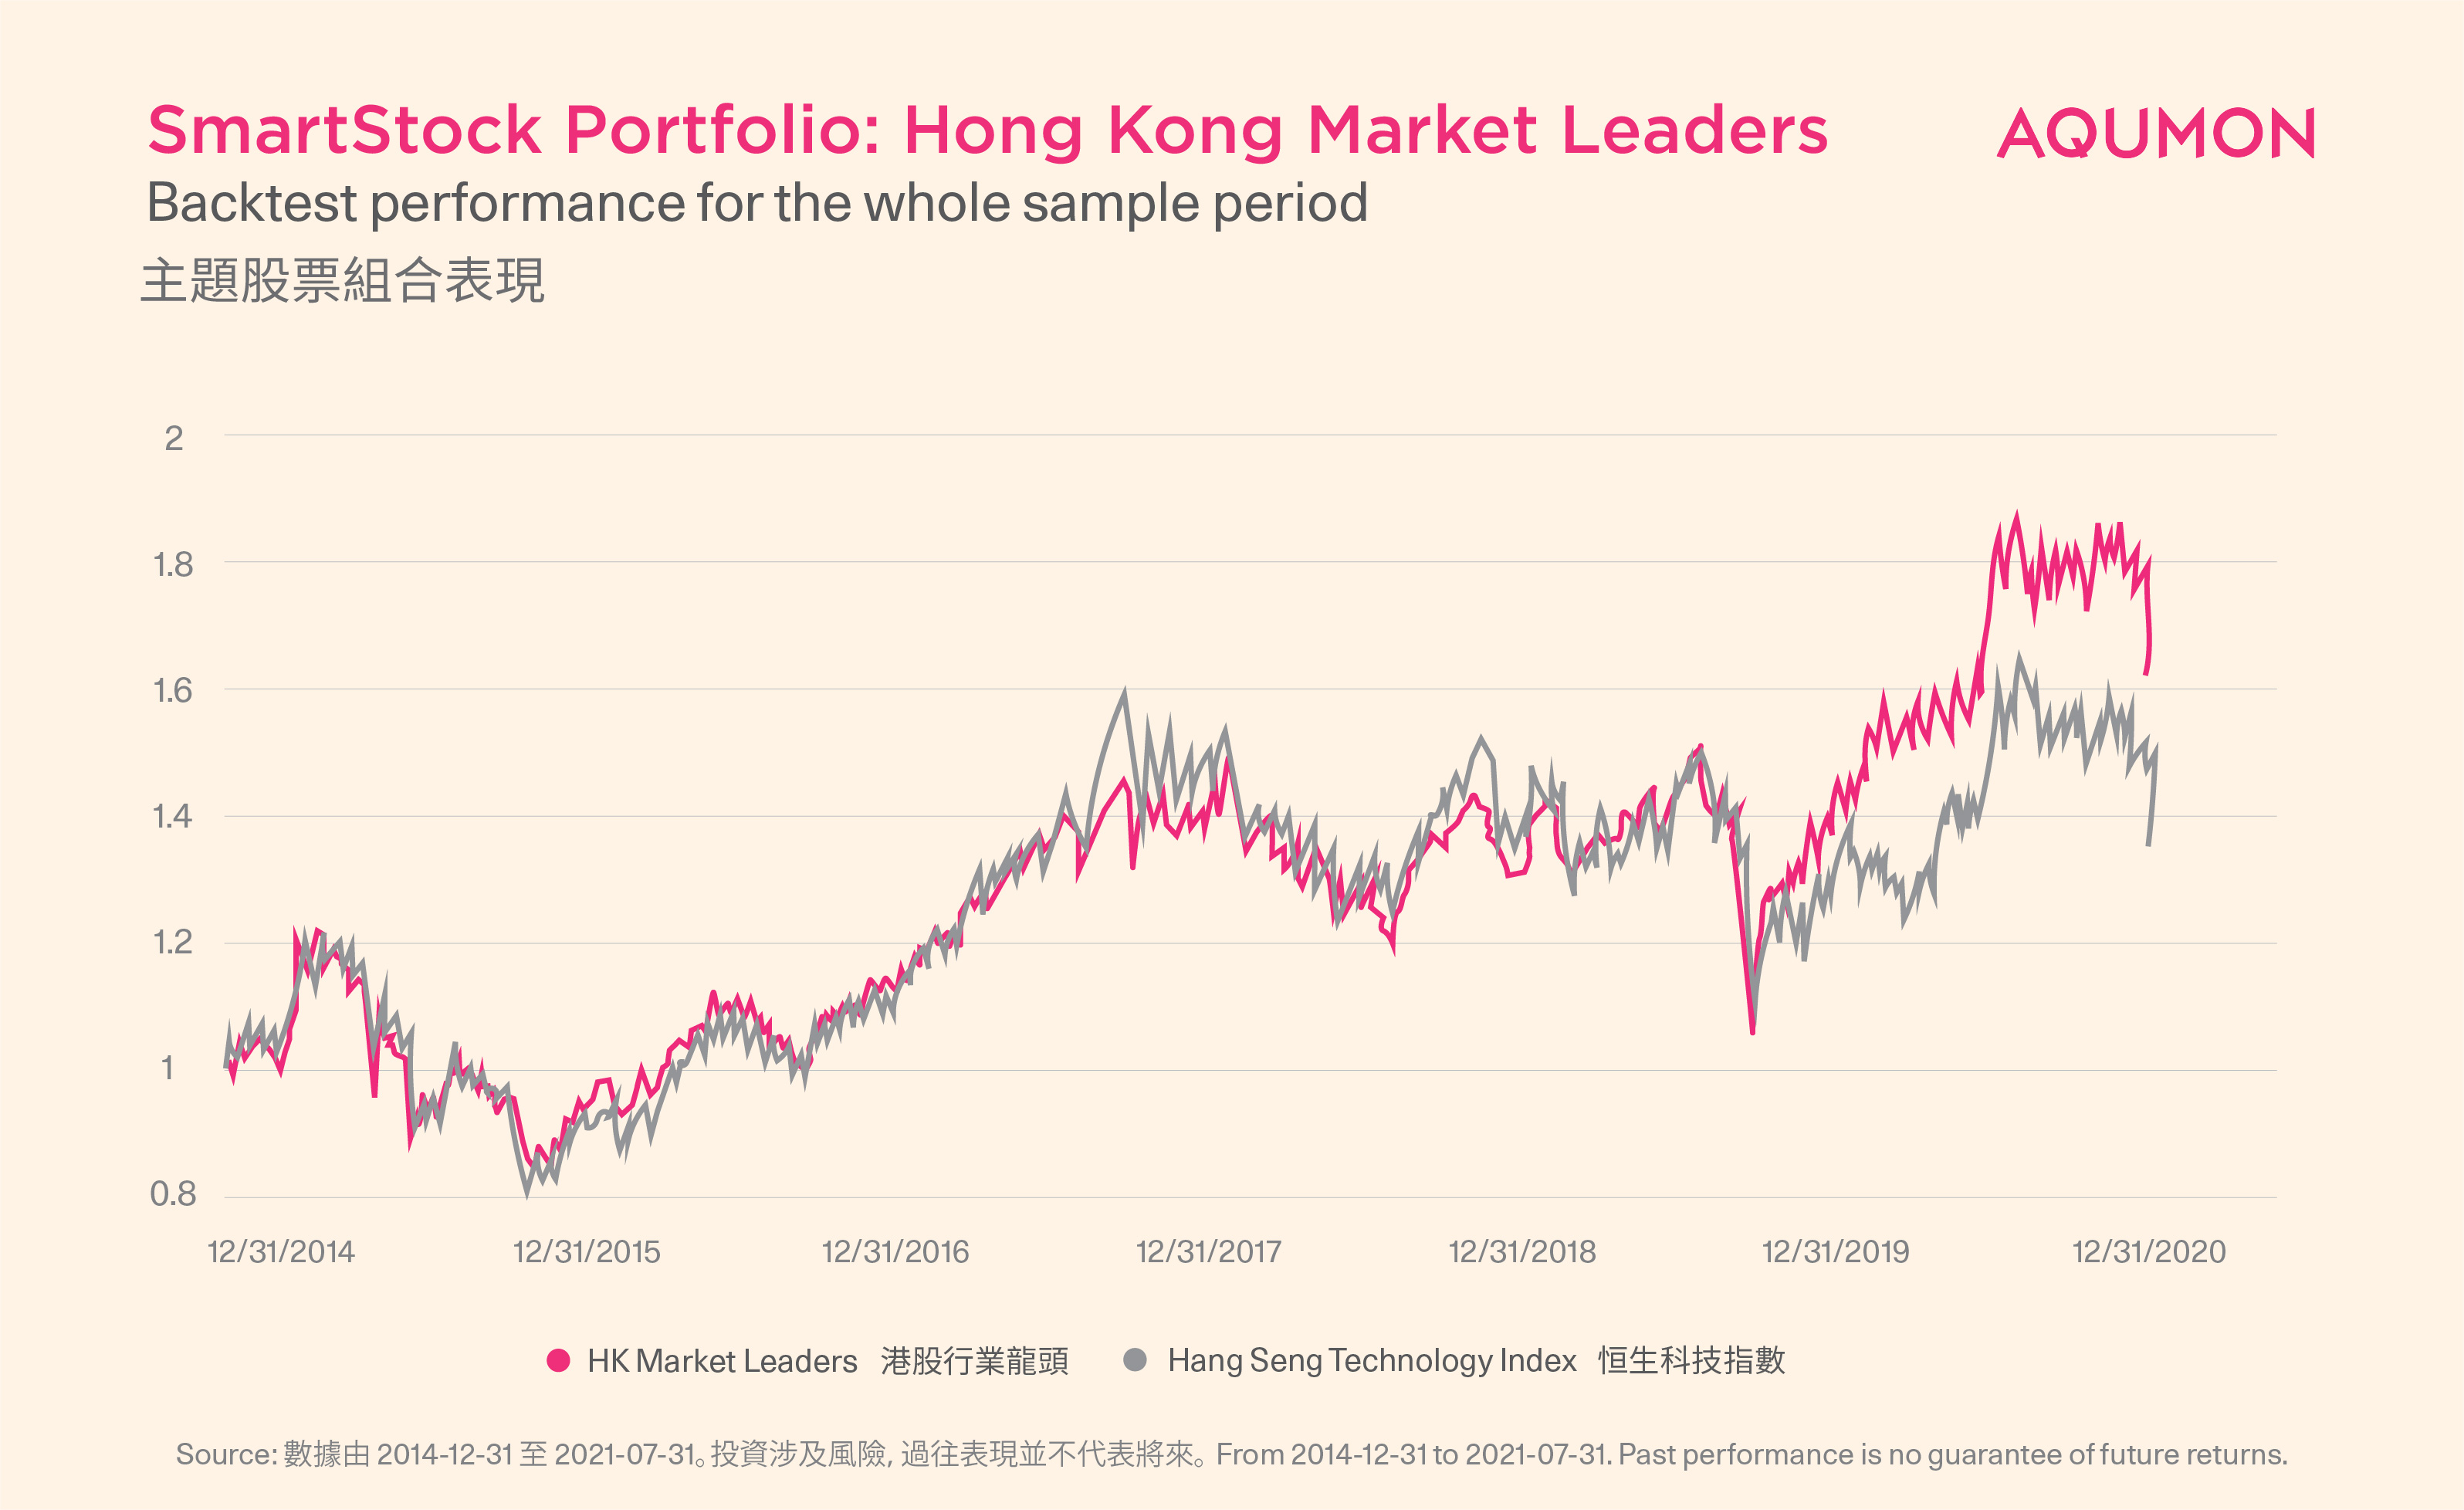
*Note: The benchmark for comparison between the industry leader and the choice of interest collection is the Hang Seng Total Return Index, and the combination will have a larger excess return than the commonly used price index .
The annualized return in the past five years is 9.82%, which is greater than the benchmark Hang Seng Index, and the maximum drawdown of the portfolio is slightly greater than the benchmark;
Since the beginning of this year, the total return of the portfolio has increased by 4.08%, while the benchmark Hang Seng Index has fallen by 2.87%. The largest drawdown of the portfolio is smaller than the benchmark.
3. Backtested performance of High Dividends
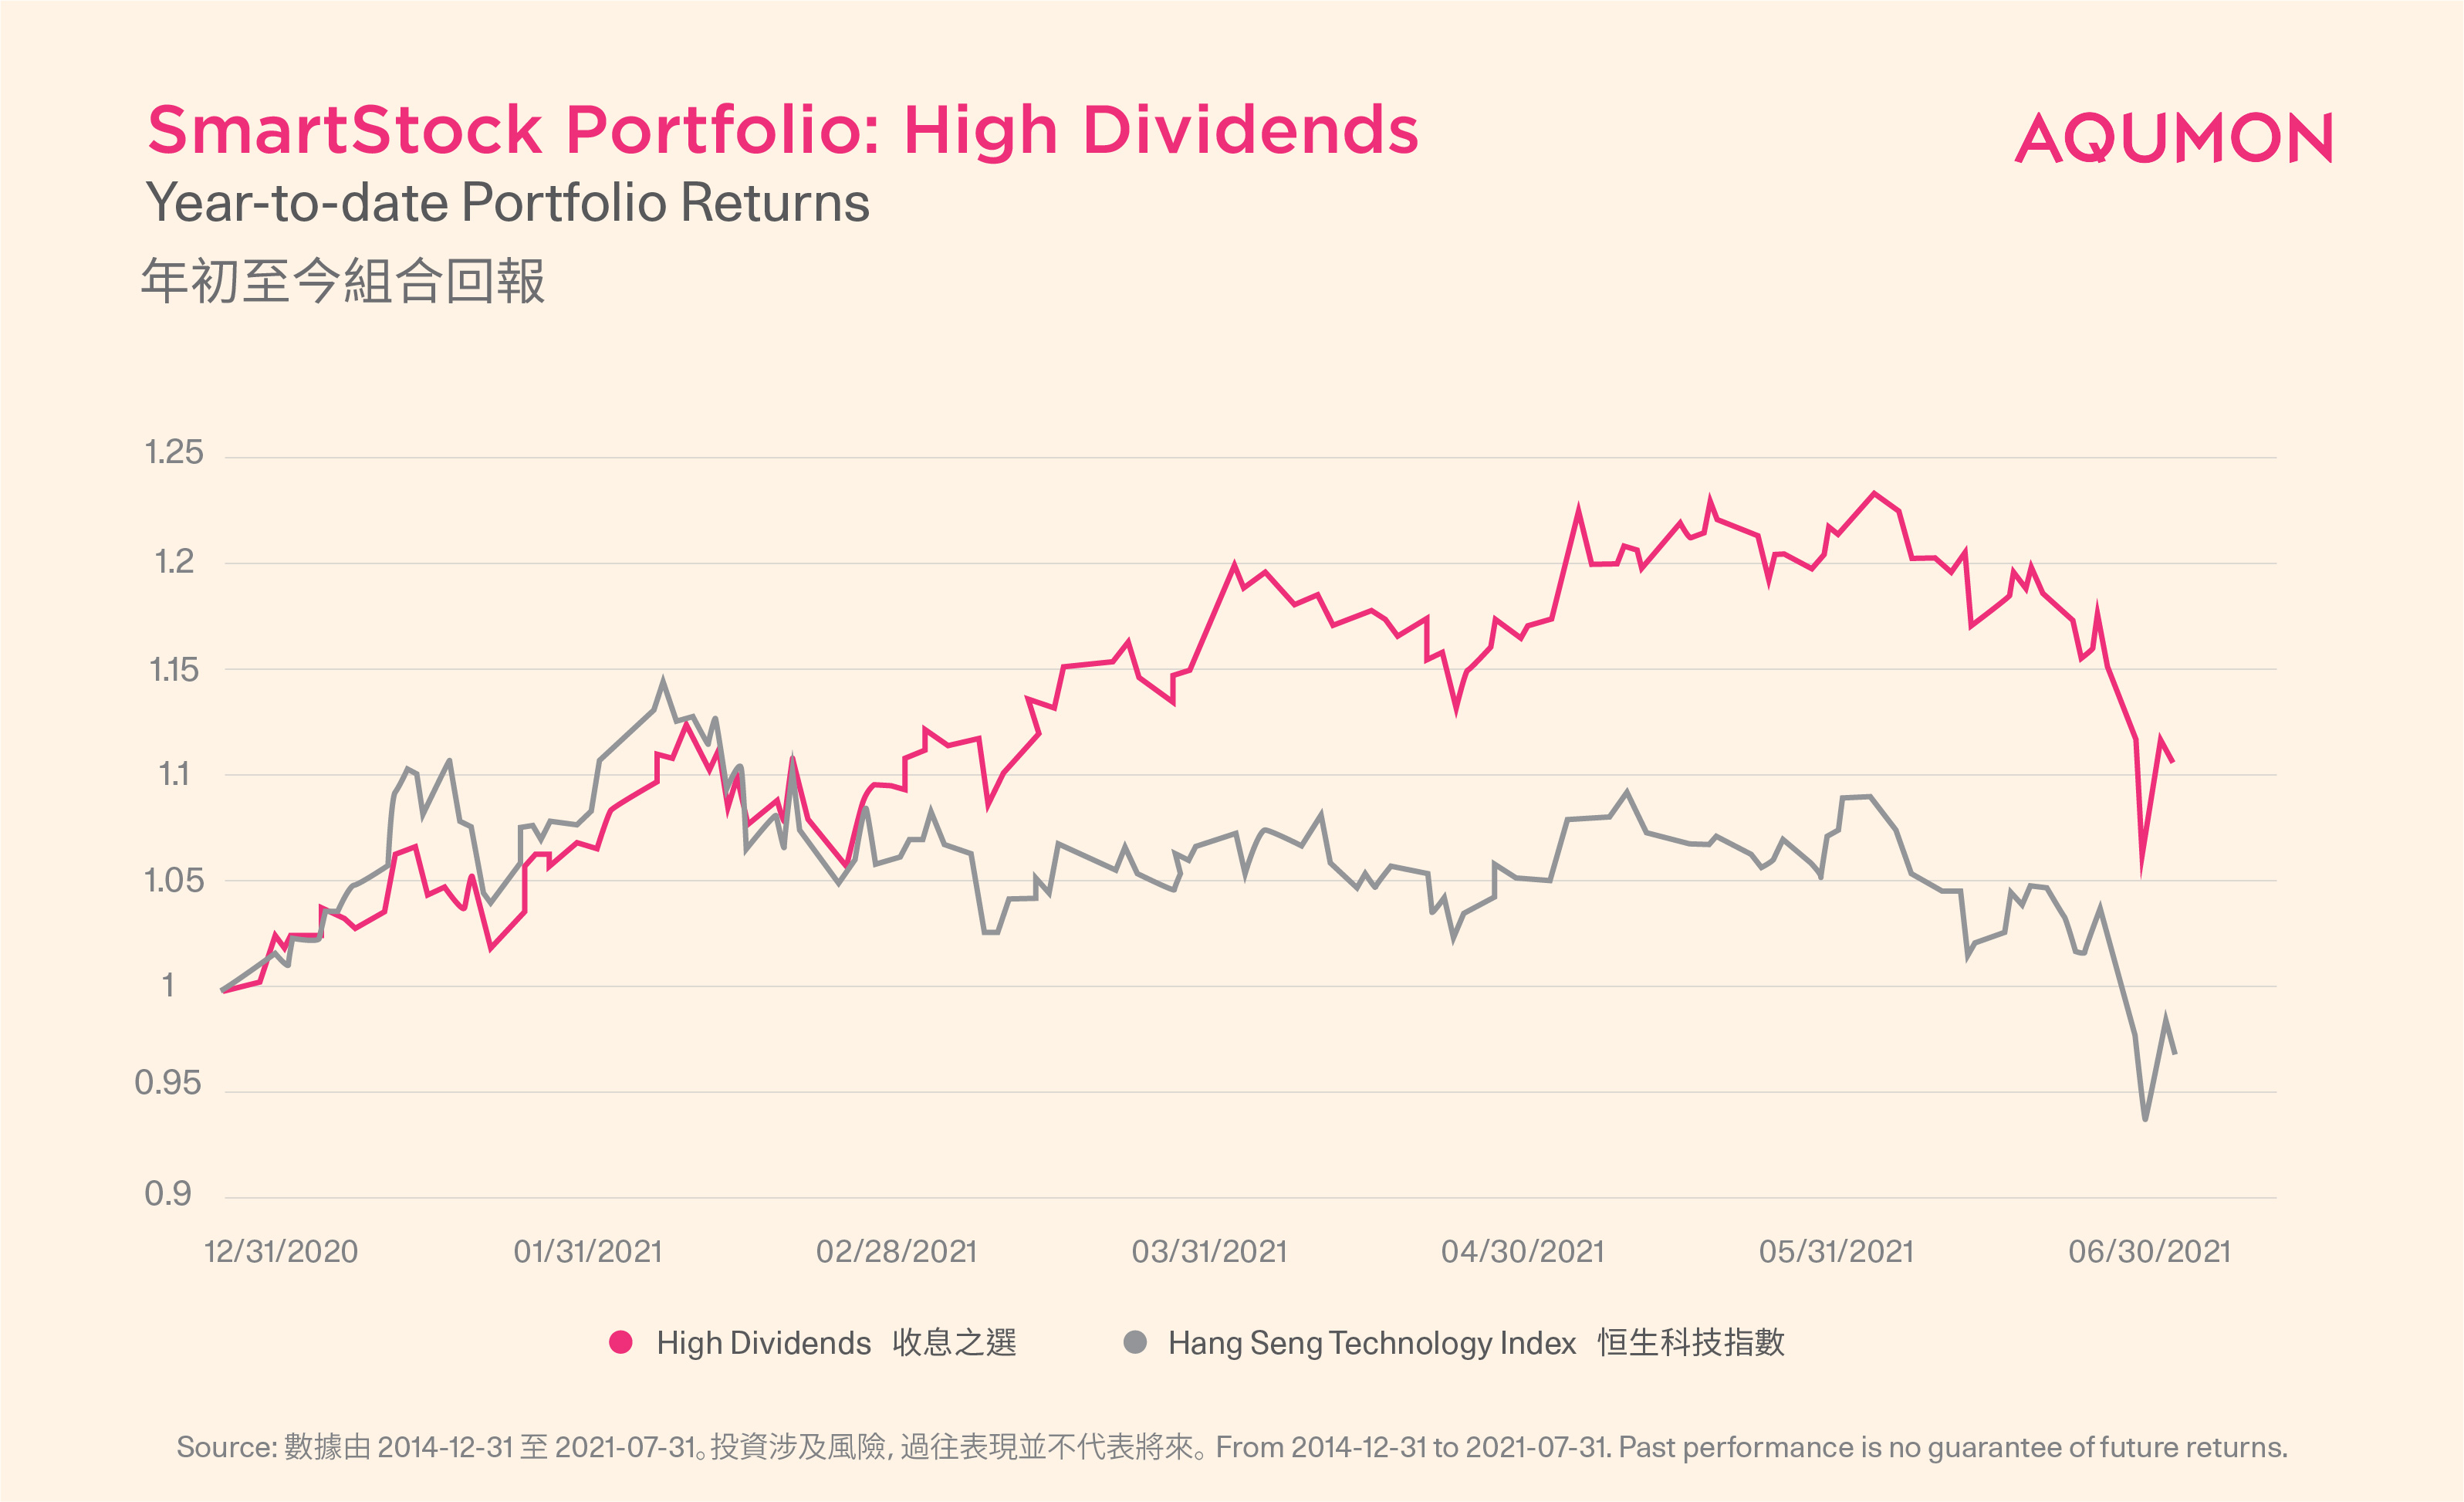
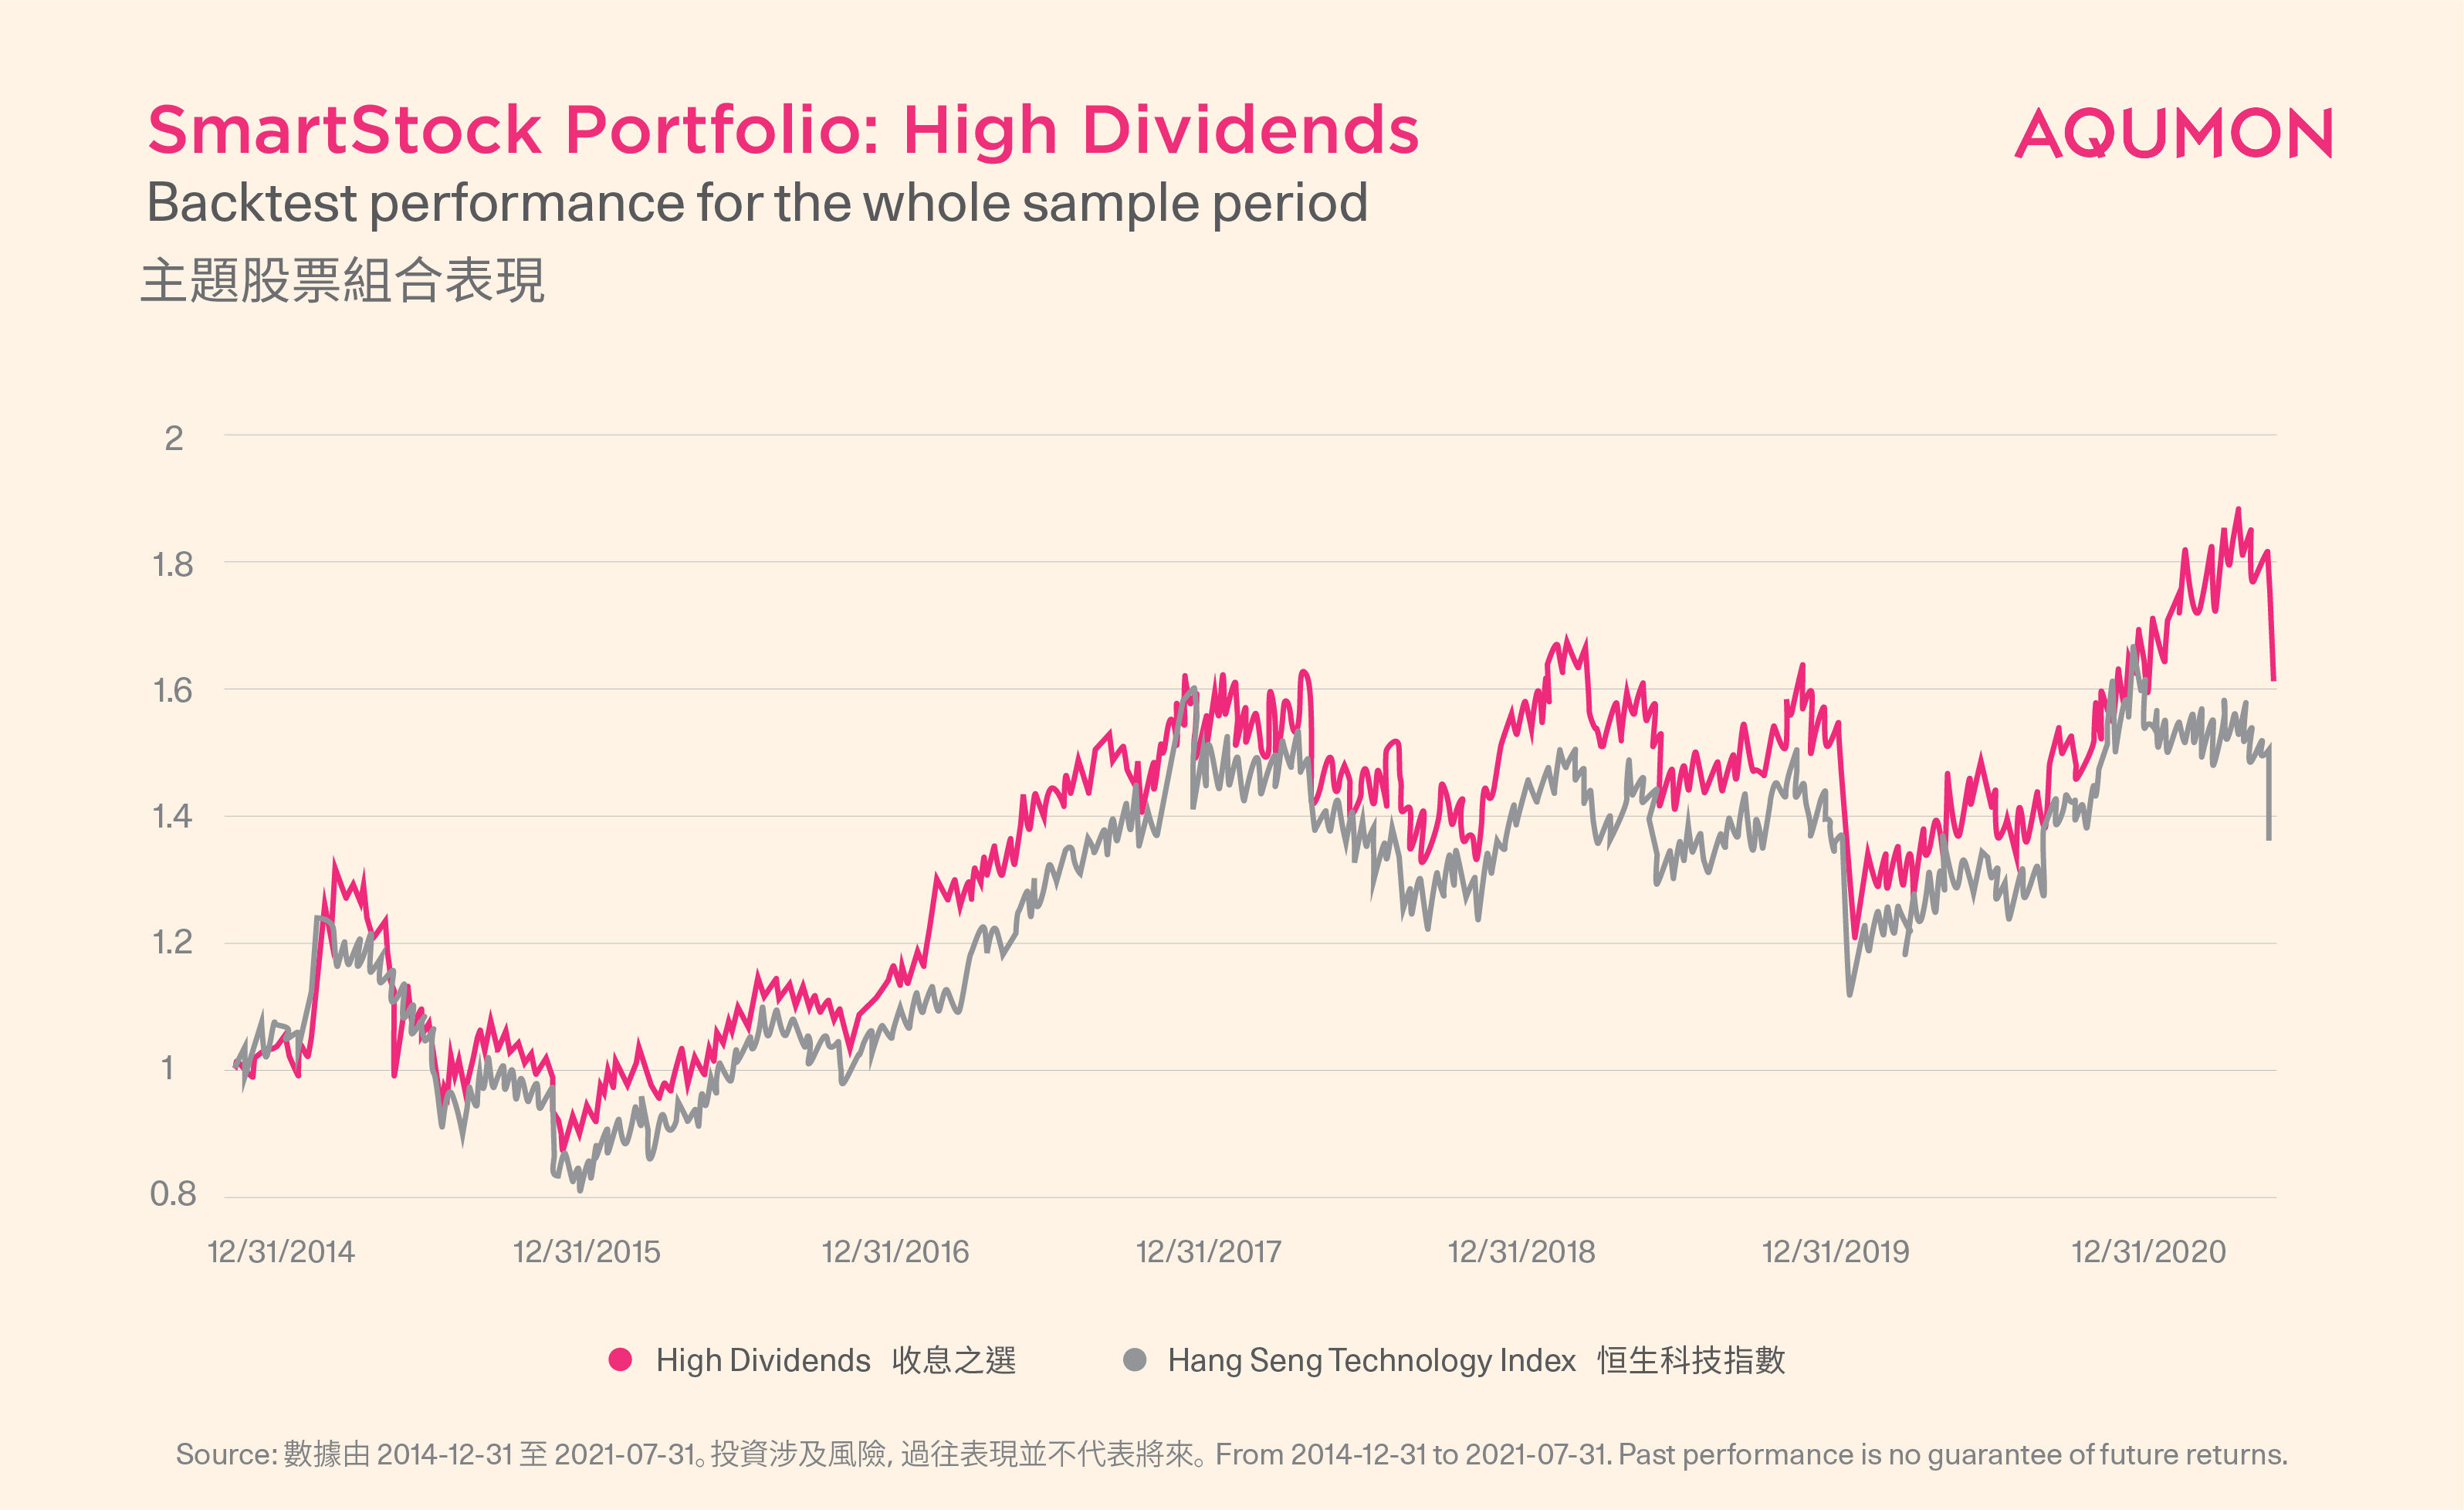
*Note: The benchmark for comparison between the industry leader and the choice of interest collection is the Hang Seng Total Return Index, and the combination will have a larger excess return than the commonly used price index.
The annualized return in the past five years is 9.28%, which is greater than the benchmark Hang Seng Index, and the maximum drawdown of the portfolio is slightly greater than the benchmark;
Since the beginning of this year, the total return of the portfolio has risen by 10.74%, while the benchmark Hang Seng Index has fallen by 2.87%. The largest drawdown of the portfolio is smaller than the benchmark.
Historical dividend data also shows that the weighted dividend yields of 2020 and the past 12 months are 4.47% and 4.59%, respectively, which are higher than the Hang Seng Index by about 89.41% and 111.52%.
4. Backtested performance of the preferred real estate portfolio
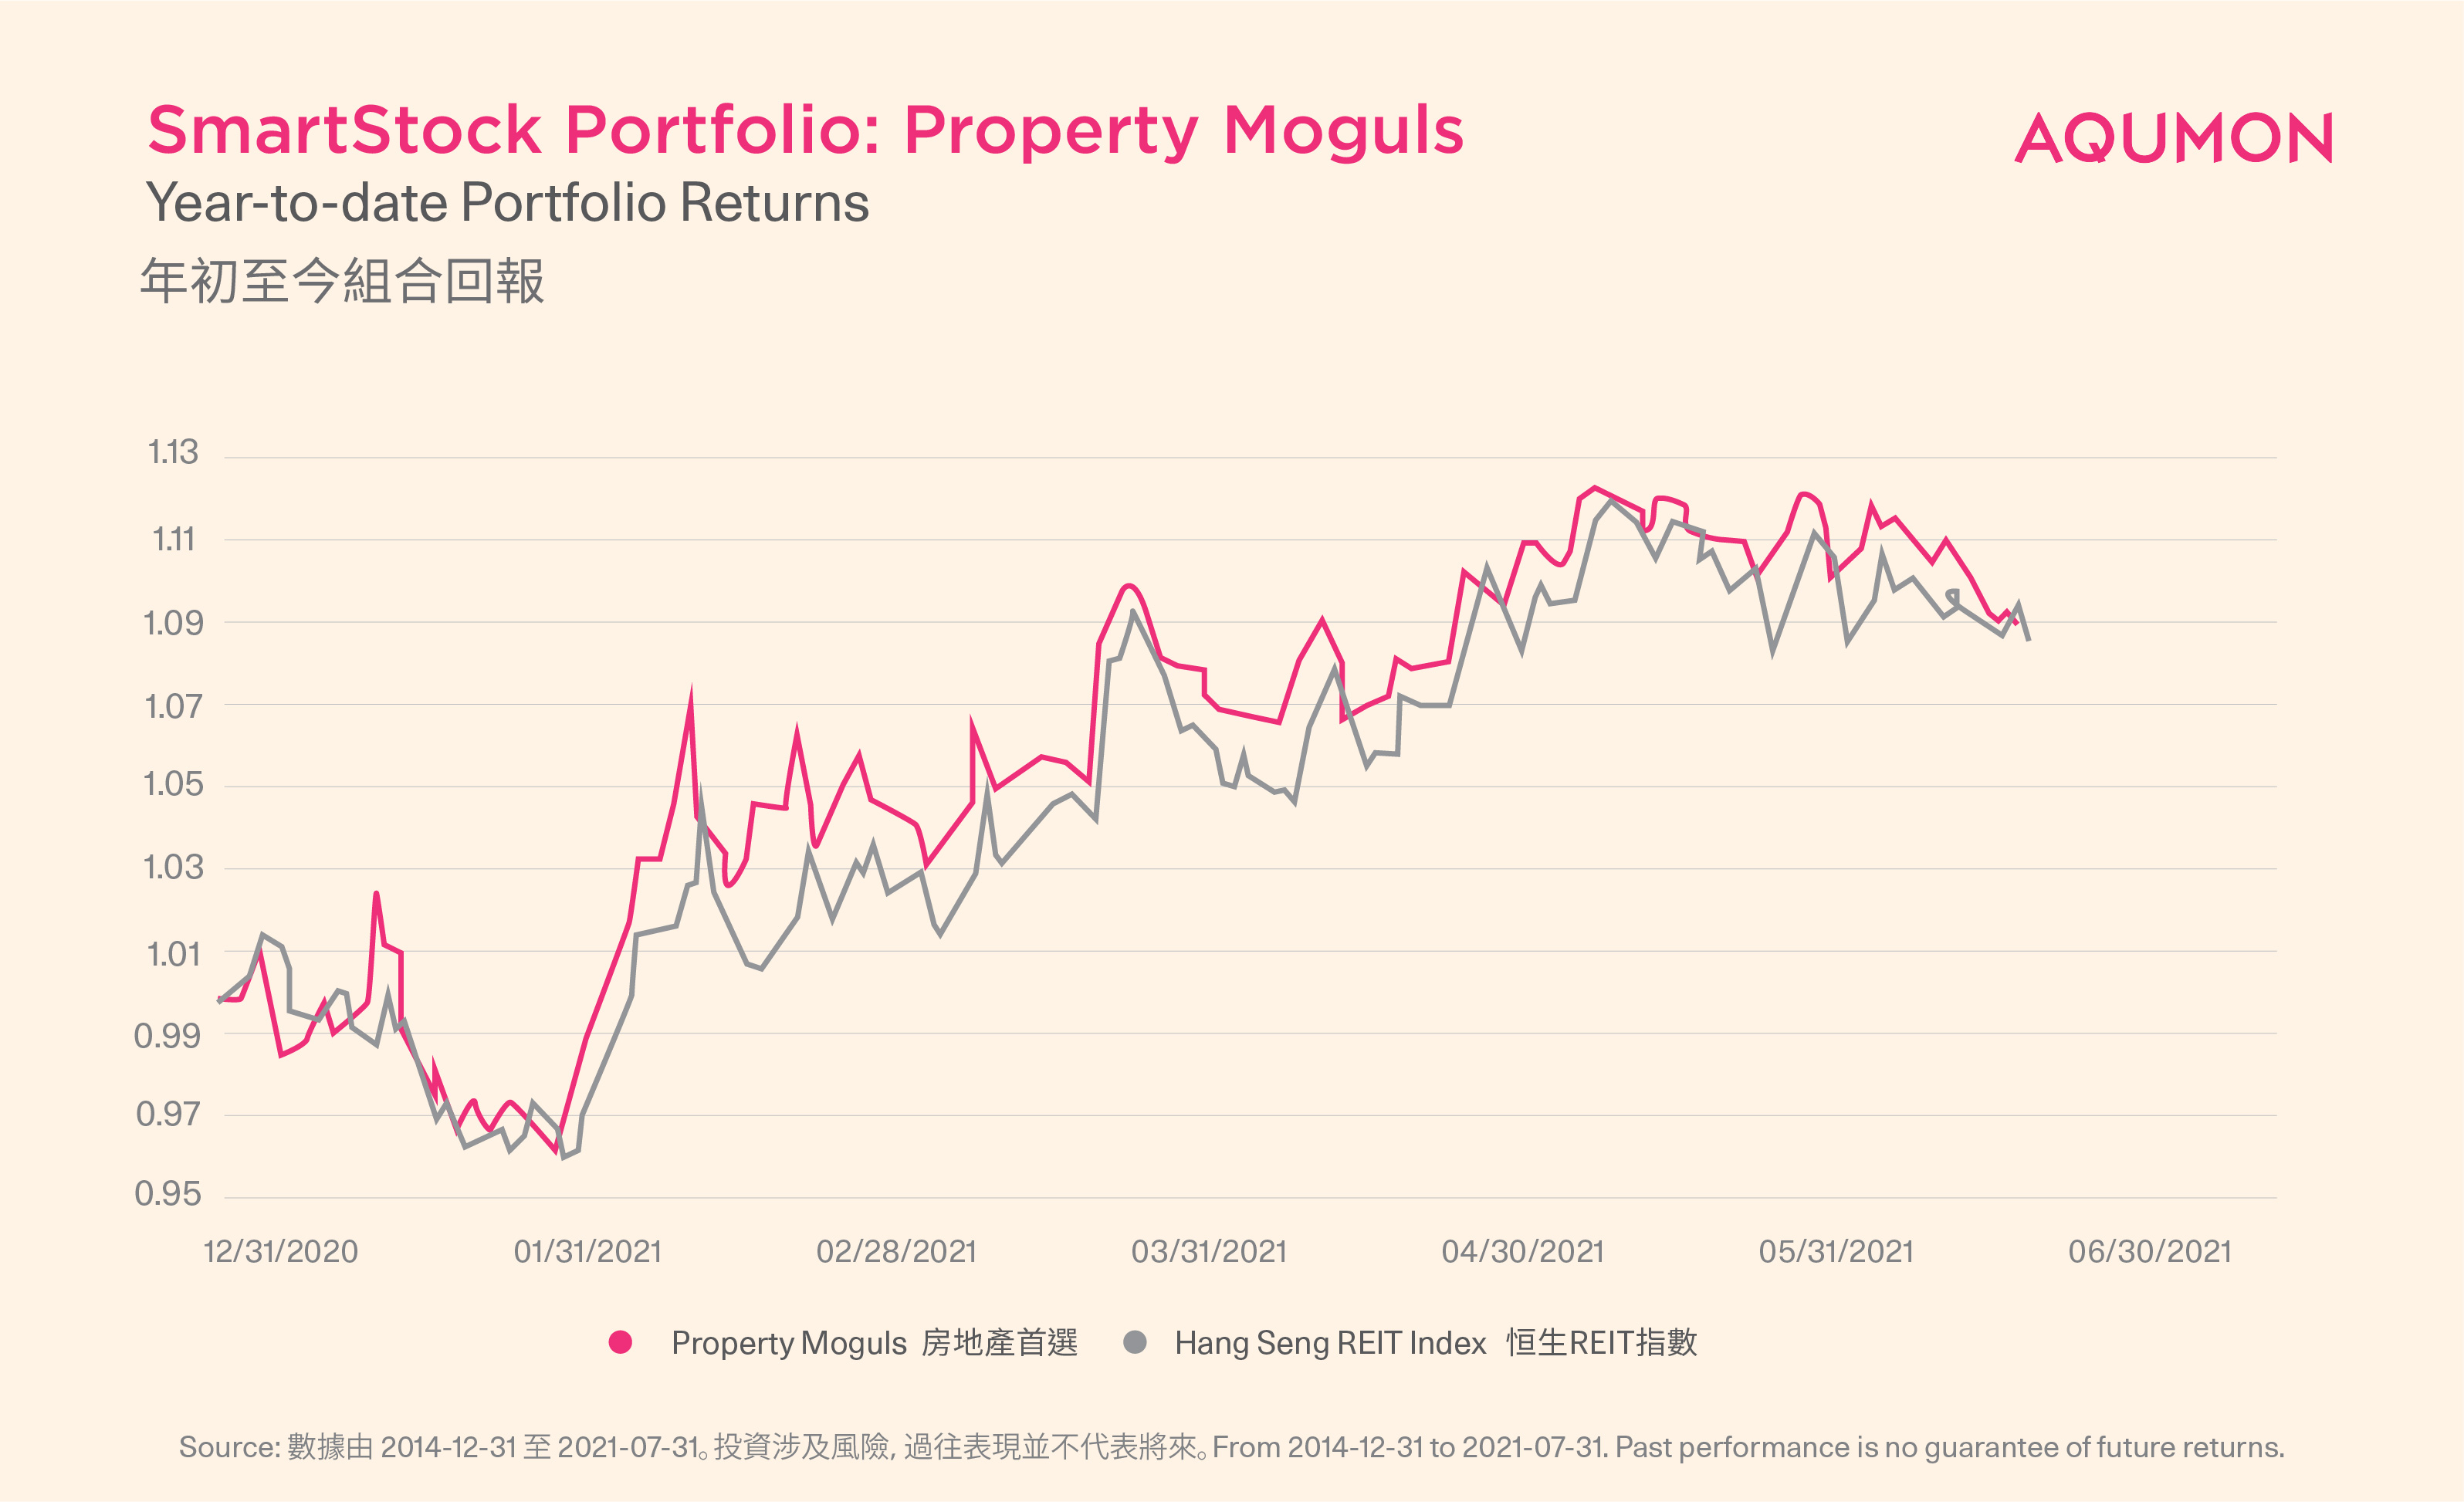
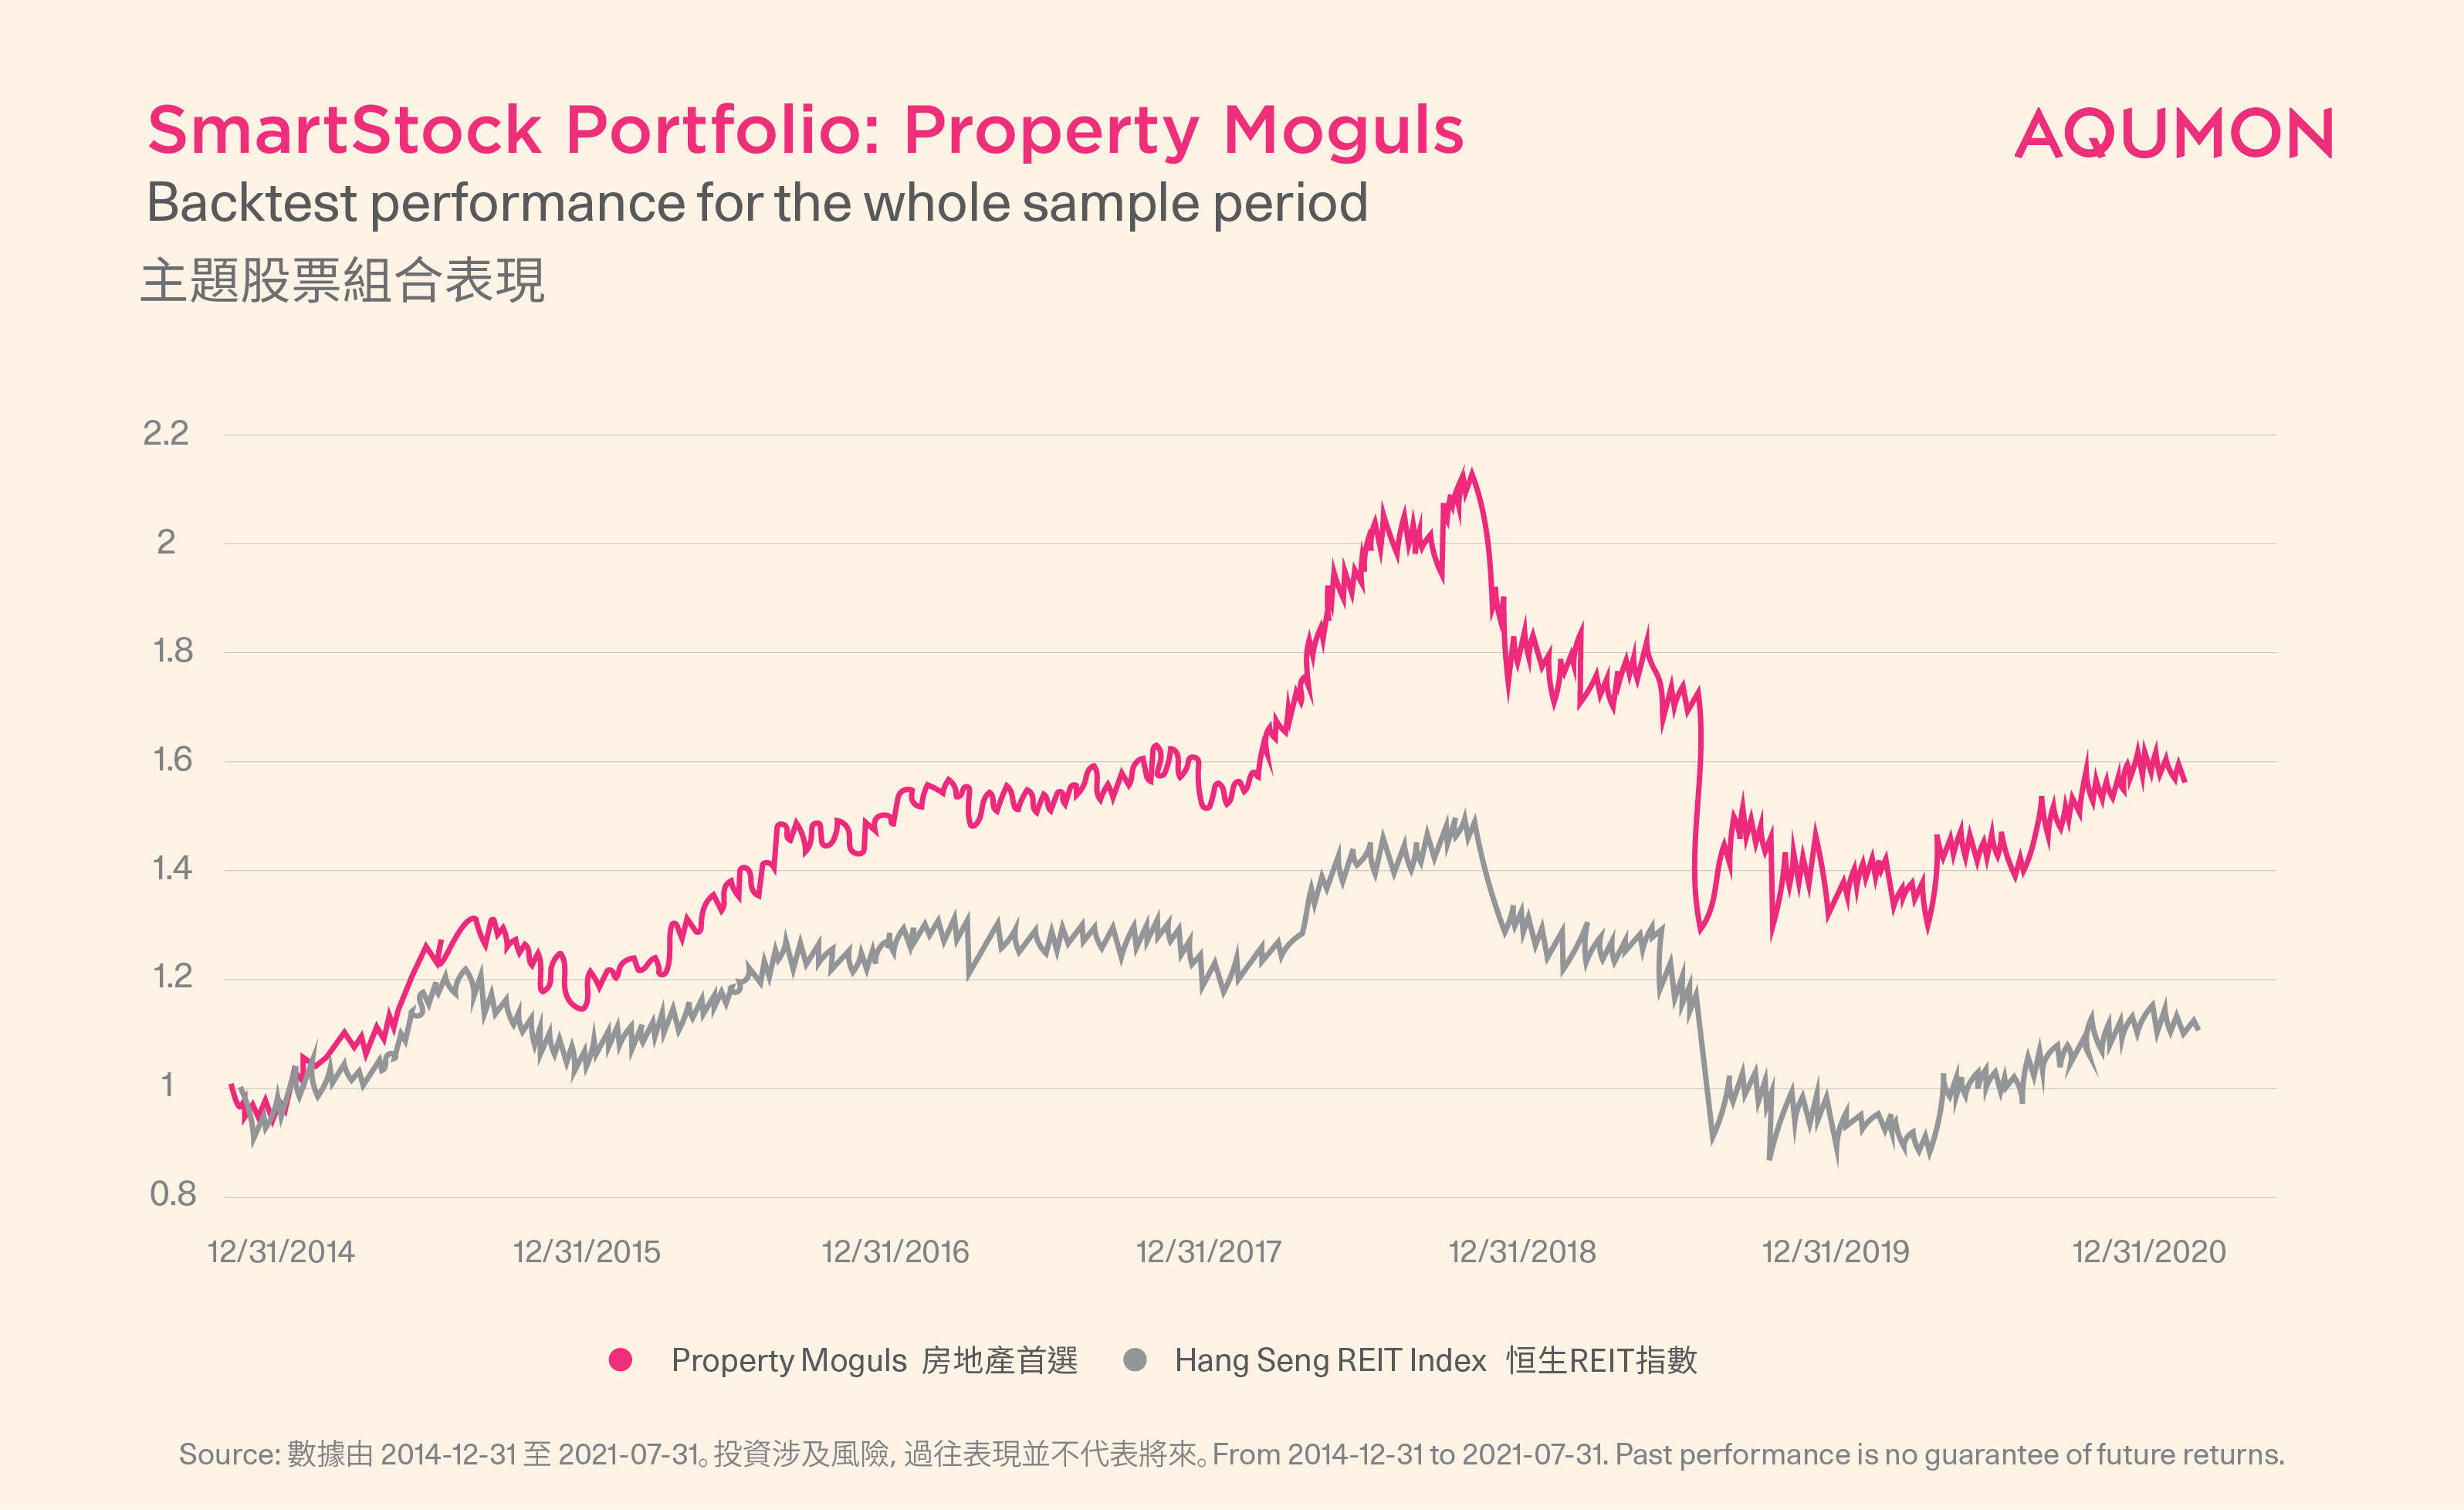
The annualized return for the past five years is 4.08%, which is greater than the benchmark Hang Seng REIT index, and the maximum drawdown of the portfolio is less than the benchmark;
Starting from this year, the total return of the portfolio has risen by 8.21%, the benchmark Hang Seng REIT Index has risen by 7.80%, and the portfolio Sharpe ratio is better than the benchmark.
Summary
In conclusion, the YTD performance for Chinese Tech Stars, Hong Kong Market Leaders, and High Dividends have improved after rebalancing. The portfolio compositions of Property Moguls have not changed much during this rebalance, hence, the YTD performance and full sample backtest performance do not vary much from the previous figures. Since we have further enhanced the factor-rating mechanism to make our strategies more stringent and resilient to changes in the market, and it is more reasonable to explain the rebalancing logic behind, we aim to provide customers with better return and lower-risk investment portfolios.
About us
AQUMON is a Hong Kong based award-winning financial technology company. Our mission is to leverage smart technology to make next-generation investment services affordable, transparent and accessible to both institutional clients and the general public. Through its proprietary algorithms and scalable, technical infrastructure, AQUMON’s automated platform empowers anyone to invest and maximise their returns. AQUMON has partnered with more than 100 financial institutions in Hong Kong and beyond, including AIA, CMB Wing Lung Bank, ChinaAMC, and Guangzhou Rural Commercial Bank. Hong Kong University of Science and Technology, the Alibaba Entrepreneurs Fund, affiliate of BOC International Holdings Limited, Zheng He Capital Management and Cyberport are among AQUMON's investors.
The brand is held under Magnum Research Limited and is licensed with Type 1, 4 and 9 under the Securities and Futures Commission (SFC) of Hong Kong. AQUMON is also licensed by the U.S. Securities and Exchange Commission (SEC) and the Asset Management Association of China (AMAC).
Disclaimer
Viewers should note that the views and opinions expressed in this material do not necessarily represent those of Magnum Research Group and its founders and employees. Magnum Research Group does not provide any representation or warranty, whether express or implied in the material, in relation to the accuracy, completeness or reliability of the information contained herein nor is it intended to be a complete statement or summary of the financial markets or developments referred to in this material. This material is presented solely for informational and educational purposes and has not been prepared with regard to the specific investment objectives, financial situation or particular needs of any specific recipient. Viewers should not construe the contents of this material as legal, tax, accounting, regulatory or other specialist of technical advice or services or investment advice or a personal recommendation. It should not be regarded by viewers as a substitute for the exercise of their own judgement. Viewers should always seek expert advice to aid decision on whether or not to use the product presented in the marketing material. This material does not constitute a solicitation, offer, or invitation to any person to invest in the intellectual property products of Magnum Research Group, nor does it constitute a solicitation, offer, or invitation to any person who resides in the jurisdiction where the local securities law prohibits such offer. Investment involves risk. The value of investments and its returns may go up and down and cannot be guaranteed. Investors may not be able to recover the original investment amount. Changes in exchange rates may also result in an increase or decrease in the value of investments. Any investment performance information presented is for demonstration purposes only and is no indication of future returns. Any opinions expressed in this material may differ or be contrary to opinions expressed by other business areas or groups of Magnum Research Limited and has not been updated. Neither Magnum Research Limited nor any of its founders, directors, officers, employees or agents accepts any liability for any loss or damage arising out of the use of all or any part of this material or reliance upon any information contained herein.